library(ggplot2)
data <- data.frame(
x = c(1, 2, 3, 4),
y = c(10, 20, 30, 40),
group = c("A", "A", "B", "B")
)
color_var <- "group"
ggplot(data, aes(x = x, y = y, color = !!as.name(color_var))) +
geom_point()
ggplot(data, aes(x = x, y = y, color = get(color_var))) +
geom_point()
ggplot(data, aes(x = x, y = y, color = !!sym(color_var))) +
geom_point()
ggplot(data, aes(x = x, y = y, color = .data[[color_var]])) +
geom_point()Basic concepts
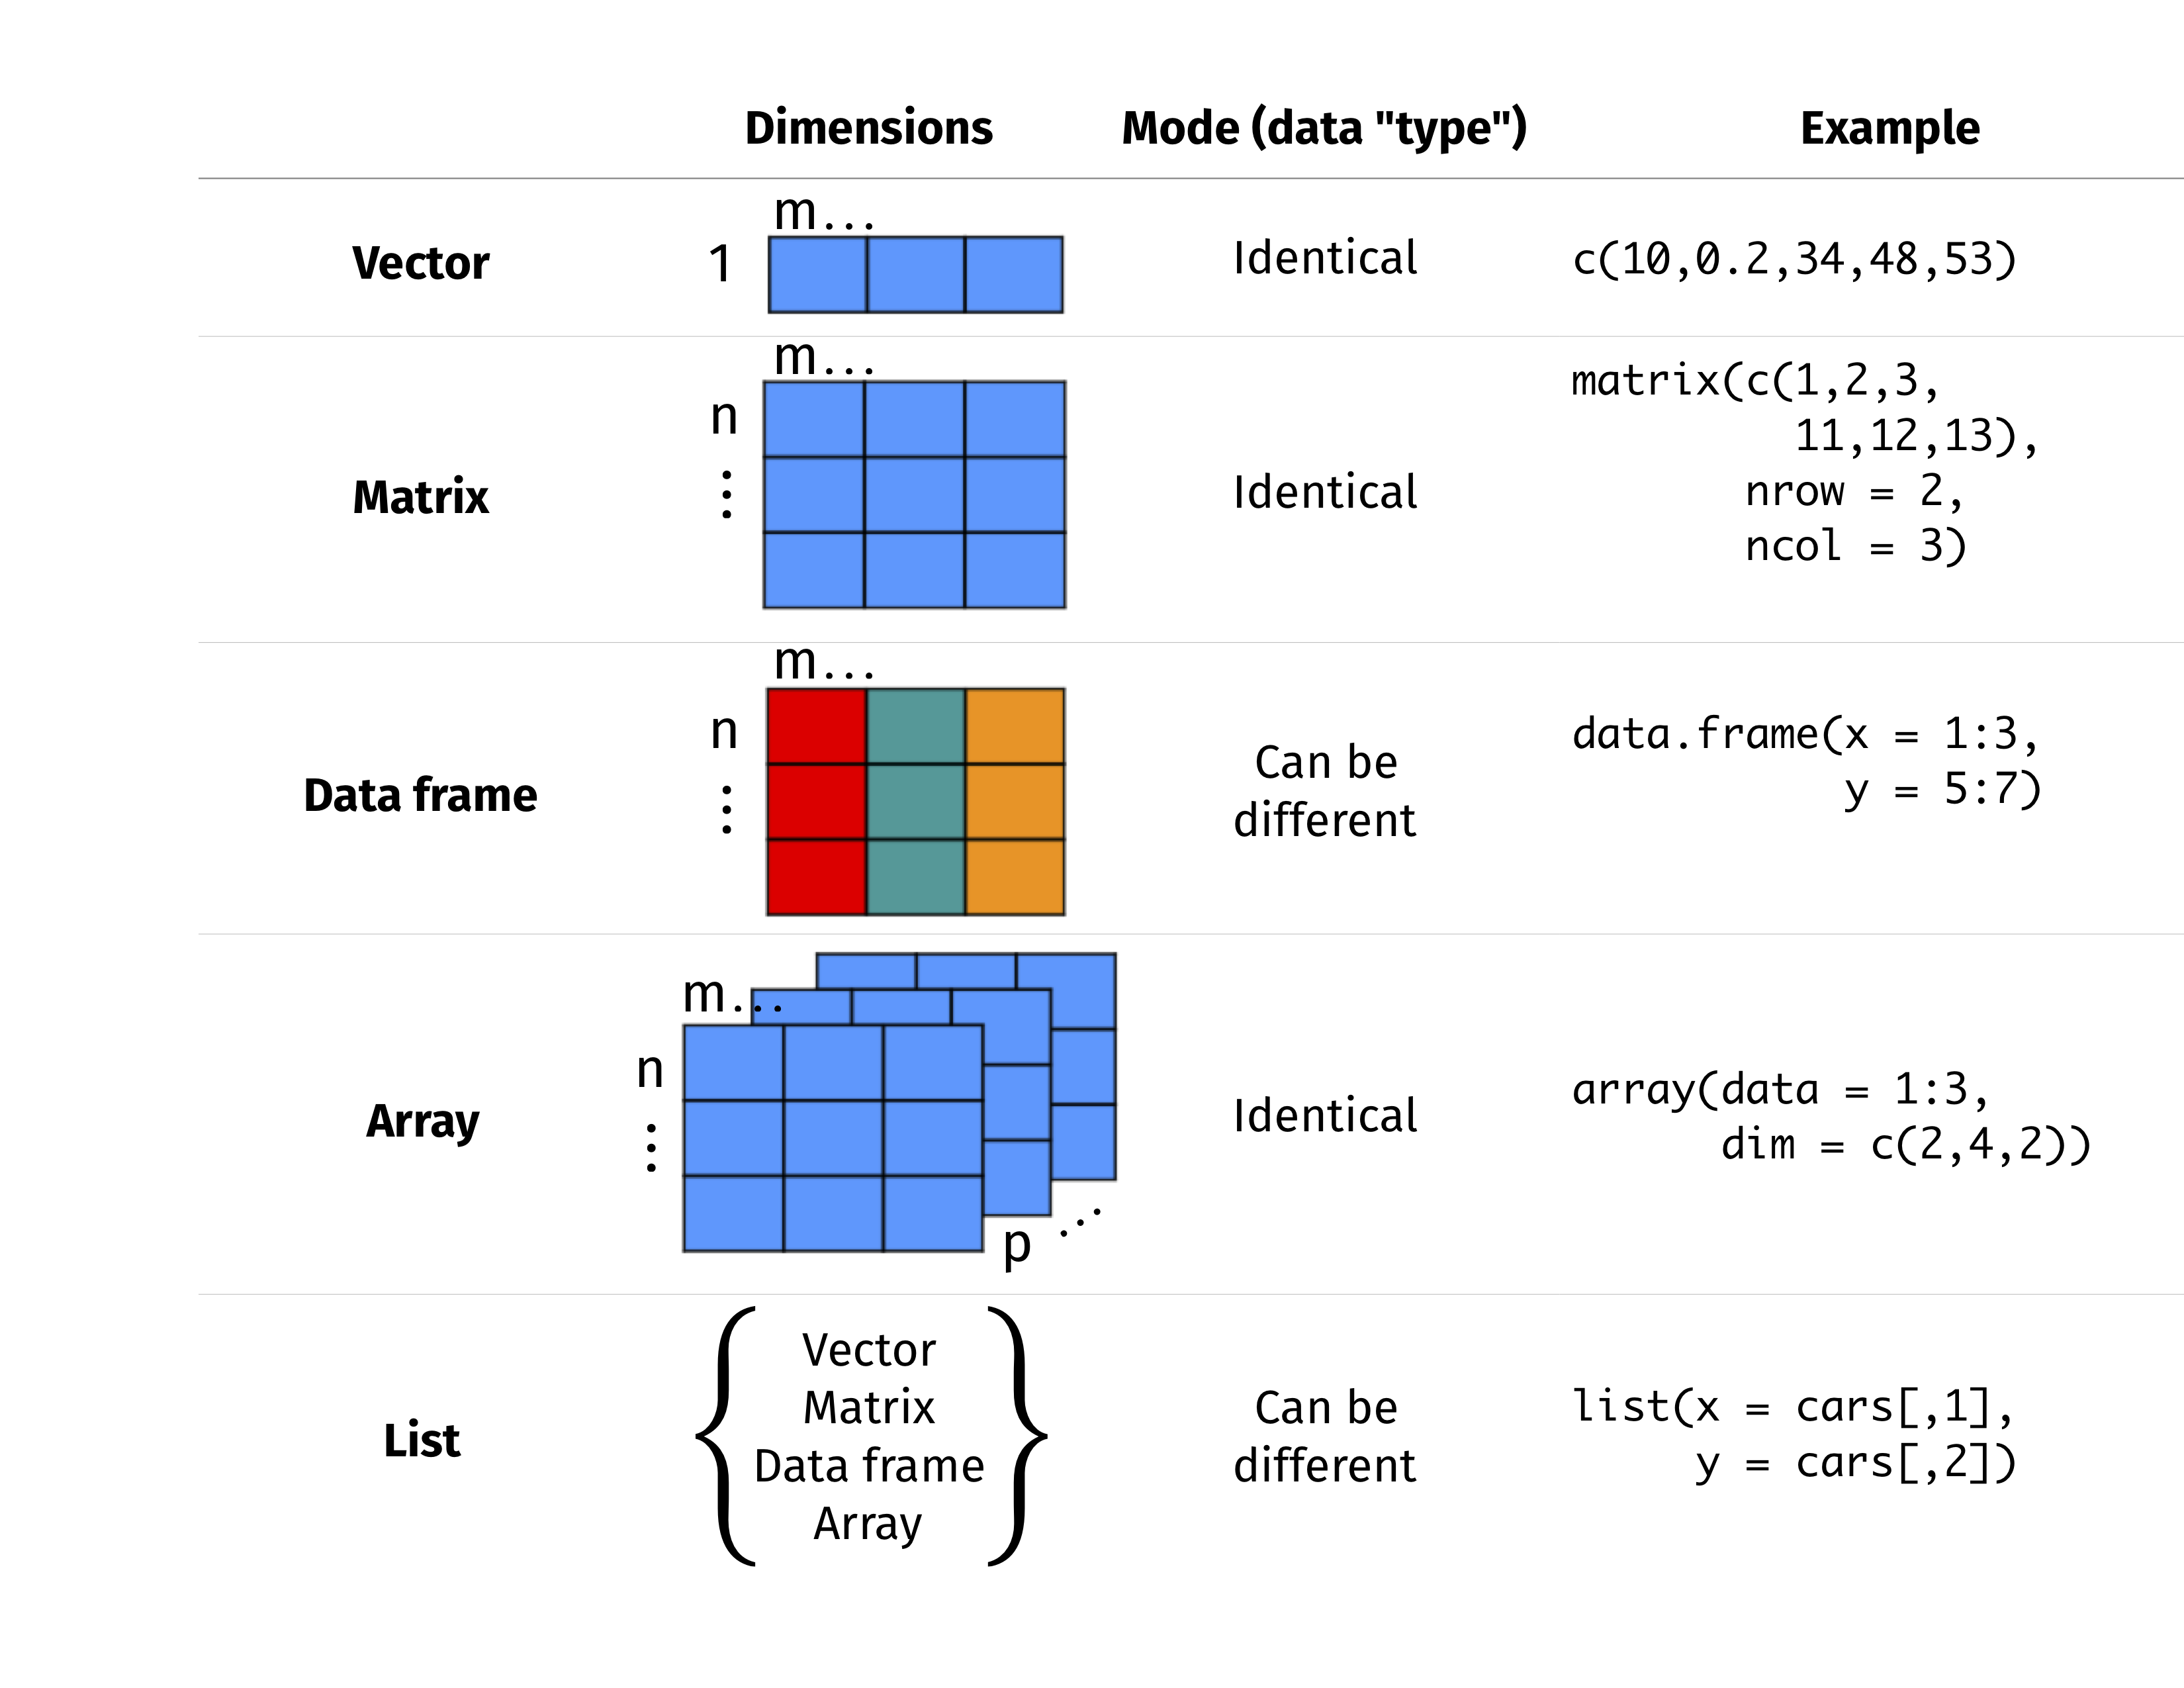
Data structure
General functions
dir()                            # Show the directory
getwd()                          # Check working directory
setwd()                          # Change working directory
data()                           # Load built-in dataset
view()                           # View the entire dataset
tail()                           # Just show the last 6 rows
class()                          # Check the class of an R object
str()                            # Display internal structure of an R object
length()                         # Give length of a vector
dim()                            # View the number of rows and columns of a matrix or a data frame
names()                          # List names of variables in a data frame
set.seed()                       # Generate random number seed to make sure the results do not change.
ls()                             # list the variables in the workspace
rm()                             # remove the variable from workspace
rm(list = ls())                  # remove all the variables from the workspace
list.files()                     # List the filename under specific directory
.libPaths()                      # R installation site
help(package="")                 # Check the functions of R library
system.file(package=“dagdata”)   # Extract the location of package
colnames(installed.packages())   # list the installed packages
Best practise for R coding
- Variables = my_variable
- Functions = RunThisStuffs()
- Constants = CONSTANTS
- Use 4 spaces (and not tab) for indentations
- Always writing documentation above function definition
- A function should not be longer than one screen
- Avoid using for loop, learn lapply and vector operations
- Never ever use hard-coded variables in functions
-
### ======to divide function blocks -
### ------to divide parts in a function - Name and style code consistently
-
rm(list =ls())andgc()to tidy up its memory - Don’t save a session history
- Keep track of
sessionInfo()in project folder - Use version control
ggplot2 Variable repacement
!!as.name(), get(), !!sym(), .data[[]]
Reference
- An Introduction to Statistical Learning
- R for Data Science (2e)
- R Graphics Cookbook, 2nd edition
- Advanced R
- ggplot2: Elegant Graphics for Data Analysis
- Functional Programming
- The Epidemiologist R Handbook
- Modern Statistics for Modern Biology
- Data Analysis and Prediction Algorithms with R
- Bioinformatics Training & Education Program
- Saving R Graphics across OSs
- Tutorial on Advanced Stats and Machine Learning with R
- Publication ready plots using ggpubr
- datanovia
- Data Analysis in Genome Biology
- Data Viz with Python and R
- PH525x series - Biomedical Data Science