
### Install and Load required packages
# if (!any(rownames(installed.packages()) == "DoubletFinder")){
#   remotes::install_github('chris-mcginnis-ucsf/DoubletFinder')
# }

library(fs)
library(here)
library(patchwork)
library(tidyverse)
library(readxl)
library(ggpubr)
library(rstatix)
library(Seurat)
library(DoubletFinder)
library(magrittr)
library(clustree)
library(magrittr)
library(RColorBrewer)
library(corrplot)
library(pheatmap)
library(ComplexHeatmap)
library(scales)
library(viridis)
library(circlize)
library(ggrepel)
library(edgeR)

options(future.globals.maxSize = 8e9)
output_path <- here("projects/2023_NC_BCexh/BCexh_scRNAseq/output")Load libraries and data setup
Preprocess scRNAseq Data
Save raw Data
### Project directory
project_dir <- here("projects/2023_NC_BCexh")
### Directory for scRNA data
input_path <- here(project_dir, "BCexh_scRNAseq/data")
output_path <- here("projects/2023_NC_BCexh/BCexh_scRNAseq/output")
### Get a list of sample names for creating seurat object from clinical info
sample_list <- read_excel(
here(project_dir, "supp_data", "Supplementary Data1.xlsx"),
### start from row3
skip = 2
) |>
pull("Patient ID") |>
map_chr(~ glue::glue("T{.x}"))
### load data to a list
obj_list <- list()
for (sample in sample_list) {
### Read counts matrix
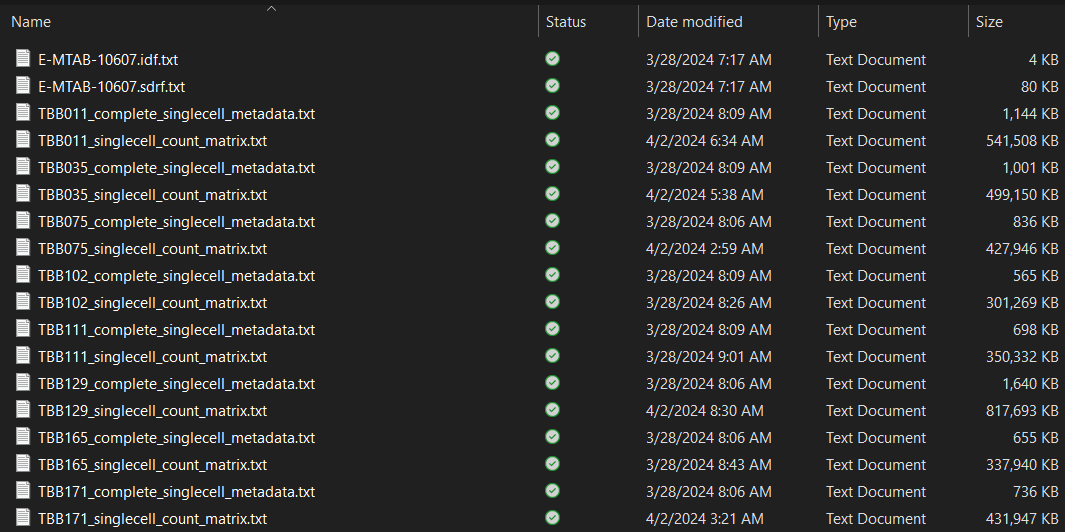
counts <- read.table(
here(input_path, paste0(sample, "_singlecell_count_matrix.txt")),
sep = "\t"
)
### Create seurat object
obj <- CreateSeuratObject(
counts = counts,
min.cells = 5, min.features = 200, project = sample
)
### Retrieve cell barcodes after filtering
cell_ids <- colnames(obj)
### Read metadata with annotation
metadata <- read.table(
here(input_path, paste0(sample, "_complete_singlecell_metadata.txt")),
sep = "\t",
header = TRUE
)
### Align the cell barcode
metadata <- metadata |>
separate_wider_delim(
cellID, delim = "_", names = c("sample_id", "cell_barcode"),
cols_remove = FALSE
) |>
mutate(cell_barcode = paste0(cell_barcode, ".1")) |>
column_to_rownames(var = "cell_barcode") |>
select(-sample_id)
metadata <- metadata[cell_ids, ]
metadata$nCount_RNA <- obj$nCount_RNA
metadata$nFeature_RNA <- obj$nFeature_RNA
# all(rownames(metadata) == colnames(obj))
### Assign metadata with new cell barcode
# obj <- AddMetaData(object = obj, metadata = metadata)
obj@meta.data <- metadata
### Save new obj
obj_list[[sample]] <- obj
}
### There are 4,.75 GB
lobstr::obj_size(obj_list)
### Look at the cells and genes for each sample
do.call(rbind, lapply(obj_list, dim))
### Save data for later exploration
fs::dir_create(output_path)
for (sample in names(obj_list)) {
obj <- obj_list[[sample]]
### Calculate mitotic/ribosomal percentage
obj <- PercentageFeatureSet(
obj, pattern = "^MT-", col.name = "percent_mito"
)
obj <- PercentageFeatureSet(
obj, pattern = "^RP[LS]", col.name = "percent_ribo"
)
### Save
saveRDS(
obj, here(output_path, paste0(sample, ".rds")),
compress = "xz"
)
}### Load data
output_path <- here("projects/2023_NC_BCexh/BCexh_scRNAseq/output")
# obj_list$TBB011[[]] |> head()
### Inspect PCA
plots <- list()
for (sample in names(obj_list)) {
plots[[sample]] <- ElbowPlot(object = obj_list[[sample]], ndim = 30) +
labs(title = sample) +
FontSize(x.text = 8, y.text = 8, x.title = 8, y.title = 8, main = 8)
}
patchwork::wrap_plots(plots[1:4], ncol = 2)
# DimHeatmap(obj_list$TBB102, dims = 10:30, cells = 500, balanced = TRUE)
# FeaturePlot(obj_list$TBB102, reduction = "tsne", features = "nFeature_RNA")
# DimPlot(obj_list$TBB102, label = TRUE, group.by = "RNA_snn_res.0.4")
# DimPlot(obj_list$TBB102, label = TRUE, reduction = "tsne")
# obj_list$TBB011[[]] |> head()
### Glimpse QC metrics
VlnPlot(
obj_list$TBB011,
features = c("nFeature_RNA", "nCount_RNA", "percent_mito"),
ncol = 1, pt.size = 0, sort = FALSE, log = TRUE
)
### Cell type
FeaturePlot(
obj_list$TBB011, reduction = "umap", ncol = 2,
features = c("CD3E", "CD14", "PTPRC", "EPCAM", "PECAM1", "FAP")
)
### Varify DoubletFinder
table(obj_list$TBB011$excl_doublet)
UMAPPlot(
obj_list$TBB011, group.by = "excl_doublet",
# order = c(TRUE, FALSE),
cols = c("black", "red")
)
table(
obj_list$TBB011@meta.data$excl_doublet,
obj_list$TBB011@meta.data$RNA_snn_res.0.4
)
obj_list$TBB011[[]] |> head()
### Sanity checks
DimPlot(obj_list$TBB011, label = TRUE)
DotPlot(obj_list$TBB011, features = c("CD3E", "CD14", "PTPRC", "EPCAM"))
FeaturePlot(obj_list$TBB011, features = c("CD3E", "CD14", "PTPRC", "EPCAM"))
FeaturePlot(obj_list$TBB011, features = c("FAP", "PECAM1", "PTPRC", "EPCAM"))
FeaturePlot(obj_list$TBB011, features = c("CD14", "CD3E"))
FeaturePlot(obj_list$TBB011, features = c("MKI67"), split.by = "excl_doublet")Aggregate samples data
### Clear environment
rm(list = ls())
gc()

### Output directory
output_path <- here("projects/2023_NC_BCexh/BCexh_scRNAseq/output")

### Samples to load
sample_list <- c(
    ### IE1
        "TBB011",
        "TBB111",
        "TBB129",
        "TBB165",
        "TBB171",
        "TBB184",
        "TBB338",

    ### IE2
        "TBB035",
        "TBB075",
        "TBB102",
        "TBB212",
        "TBB214",
        "TBB226",
        "TBB330"
    )

### Load IE1 vs IE2 samples for easier processing
obj_list <- list()
for (sample in sample_list) {
    ### Load data
    obj <- readRDS(here(output_path, paste0(sample, ".rds")))

    obj_list[[sample]] <- obj
}

### Merge objects
merged_pre_filter <- merge(
    x = obj_list[[1]], y = obj_list[-1], add.cell.ids = names(obj_list)
)
### 4.75GB
lobstr::obj_size(merged_pre_filter)

### Remove for efficient memory
rm(obj_list, obj)

### Need to Join layers in Seurat V5
merged_pre_filter[["RNA"]] <- JoinLayers(merged_pre_filter[["RNA"]])

### Excluding high-confidence doublets
table(merged_pre_filter$sample, merged_pre_filter$excl_doublet)
merged_pre_filter <- subset(merged_pre_filter, subset = excl_doublet == FALSE)

### Save cell count data for each sample
cells_per_sample <- table(merged_pre_filter@meta.data$sample)
write.csv(
    cells_per_sample,
    here(output_path, "CellsPerSample_preFilter.csv"),
    row.names = FALSE
)

### 4.26 GB
lobstr::obj_size(merged_pre_filter)
Inspect the quality metrics
### Load data
merged_pre_filter <- readRDS(here(output_path, "merged_pre_filter.rds"))

### Vlnplot
VlnPlot(
    merged_pre_filter,
    features = c("nFeature_RNA", "nCount_RNA", "percent_mito"),
    ncol = 1, pt.size = 0, sort = FALSE, log = TRUE
)

### Density plot
plot(
    density(merged_pre_filter@meta.data$percent_mito),
    main = "Mitochondrial Percentage Density Plot",
    xlab = "Percent Mitochondrial Genes"
)
plot(
    density(merged_pre_filter@meta.data$nCount_RNA),
    main = "Total Reads",
    xlab = "Total Reads per Cell"
)
plot(
    density(merged_pre_filter@meta.data$nFeature_RNA),
    main = "Number of detected genes",
    xlab = "Deteced Genes per cell"
)
### Filtering low quality cells
merged_post_filter <- subset(
merged_pre_filter,
subset = nFeature_RNA > 200 &
nFeature_RNA < 7500 &
percent_mito < 20 &
nCount_RNA < 75000
)
### Save cell count data for each sample post filtering
cells_per_sample <- table(merged_post_filter@meta.data$sample)
write.csv(
cells_per_sample,
here(output_path, "CellsPerSample_postFilter.csv"),
row.names = FALSE
)
### Save mean reads and median gene counts per cell for each sample
mean_reads <- as_tibble(
merged_post_filter@meta.data[, c("sample", "nCount_RNA", "nFeature_RNA")]
) |>
group_by(sample) |>
summarise(
mean_reads = mean(nCount_RNA),
median_genes = median(nFeature_RNA),
.groups = "drop"
)
write.csv(mean_reads, here(output_path, "postfilter_stats.csv"))
### Save
saveRDS(
merged_post_filter, here(output_path, "merged_post_filter.rds"),
compress = "xz"
)Run general workflow
### Maxmize memory usage
# future::plan("multiprocess", workers = 2)
# options(future.globals.maxSize = 5* 1000 * 1024^2)

### Load data
merged_post_filter <- readRDS(here(output_path, "merged_post_filter.rds"))

### Option: Apply sctransform normalization: replaces FindVariableFeatures,
### Normalize and ScaleData. For a start, don't regress out anything
### Note! This step comsumes a lot memory
# merged_post_filter <- SCTransform(merged_post_filter, verbose = TRUE)

### Standard normalization
merged_post_filter <- NormalizeData(merged_post_filter)
merged_post_filter <- ScaleData(merged_post_filter)
merged_post_filter <- FindVariableFeatures(
    merged_post_filter,
    x.low.cutoff = 0.0125, y.cutoff = 0.25, do.plot = FALSE
)

merged_post_filter <- RunPCA(
    merged_post_filter,
    features = VariableFeatures(merged_post_filter),
    verbose = FALSE
)

### Find the resolution: Clustree analysis
# clustree(merged_post_filter, prefix = "RNA_snn_res.", exprs = "scale.data")

### Graph-based clustering
merged_post_filter <- FindNeighbors(merged_post_filter, dims = 1:27)
merged_post_filter <- FindClusters(merged_post_filter, resolution = 2)
merged_post_filter <- RunUMAP(merged_post_filter, dims = 1:27)

### If the clusters are not ordered correctly:
# cluster_order <- c(0:57)
# merged_post_filter@active.ident <- factor(x = merged_post_filter@active.ident, levels = cluster_order)

### Save object to easily load it back without re-running computationally
### intensive steps above
saveRDS(
    merged_post_filter,
    here(output_path, "merged_complete_umap.rds"),
    compress = "xz"
)
### Load processed data from output directory
output_path <- here("projects/2023_NC_BCexh/BCexh_scRNAseq/output")
merged_post_filter <- readRDS(here(output_path, "merged_complete_umap.rds"))
### Examine and visualize PCA results in a few different ways
print(
x = merged_post_filter[["pca"]],
dims = 1:5, nfeatures = 5, projected = FALSE
)
### For easy exploration of the primary sources of heterogeneity in a dataset
# DimHeatmap(merged_post_filter, dims = 1:6, cells = 500, balanced = TRUE)
# VizDimLoadings(merged_post_filter, dims = 1:2)
ElbowPlot(merged_post_filter, ndim = 50)
### Inspect cluster
p1 <- DimPlot(merged_post_filter, reduction = "umap", group.by = "sample") +
theme(legend.position = "top")
p2 <- DimPlot(merged_post_filter, reduction = "umap", group.by = "cell_type") +
theme(legend.position = "top")
p1 + p2 + plot_layout(nrow = 1)
### Check some marker expression
FeaturePlot(
merged_post_filter, reduction = "umap",
features = c("PECAM1", "EPCAM", "FAP", "PTPRC", "CD3E", "CD14")
)
### Save number of clusters and cells per cluster post filtering
cells_per_cluster <- table(merged_post_filter@meta.data$SCT_snn_res.2)
write.csv(
cells_per_cluster,
here(outpath, "dim27_res2_CellsPerCluster.csv"), row.names = FALSE
)
### Save cluster proportions by sample
cluster_sample <- table(
Idents(merged_post_filter), merged_post_filter$sample
)
write.csv(
cluster_sample,
here(output_path, "cellnr_per_cluster_bySample.csv"),
row.names = TRUE
)
cluster_sample_prop <- prop.table(
table(Idents(merged_post_filter), merged_post_filter$sample),
margin = 2
)
write.csv(
cluster_sample_prop,
here(output_path, "cluster_samples_proportions.csv"),
row.names = TRUE
)Finding DEG for clusters
Idents(merged_post_filter) <- merged_post_filter$seurat_clusters
cluster_markers_mast <- FindAllMarkers(
    merged_post_filter,
    test.use = "MAST",
    only.pos = TRUE, min.pct = 0.25,
    logfc.threshold = 0.25,
)
write.csv(
    cluster_markers_mast,
    here(output_path, "DE_cluster_AllMarkerGenes_MAST.csv"),
    row.names = FALSE
)

### Top10 DEG for each cluster
marker_genes <- cluster_markers_mast |>
    group_by(cluster) |>
    slice_max(avg_log2FC, n = 10)
write.csv(
    marker_genes,
    here(output_path, "DE_cluster_MarkerGenesTop10.csv"),
    row.names = TRUE
)
Annotate cell types
Cell type frequencies
### Load processed scRNA data
merged_post_filter <- readRDS(here(output_path, "merged_complete_umap.rds"))

### Extract group info
sample_info <- merged_post_filter[[]] |>
    select(sample, IE) |>
    distinct()

### Assign pDC or cDC to dendritic cell
# merged_post_filter$cell_type[merged_post_filter$cell_type == "pDC"] <- "dendritic cell"

### Reset active IDs to cell type
Idents(merged_post_filter) <- "cell_type"
levels(Idents(merged_post_filter))
table(Idents(merged_post_filter))

### Save cell number of cell type
celltype_sample <- table(
    merged_post_filter$cell_type, merged_post_filter$sample
)
write.csv(
    celltype_sample, here(output_path, "celltype_samples.csv"),
    row.names = TRUE
)

### Save proportions of cell type for each sample
celltype_sample_prop <- prop.table(
    table(merged_post_filter$cell_type, merged_post_filter$sample),
    margin = 2
)
write.csv(
    celltype_sample_prop,
    here(output_path, "celltype_samples_proportions.csv"),
    row.names = TRUE
)

### Ploty cell type frequencies using stacked barplot
celltype_sample_prop <- read.csv(
    here(output_path, "celltype_samples_proportions.csv")
) |>
    pivot_longer(
        starts_with("TB"), names_to = "sample", values_to = "percentage"
    ) |>
    dplyr::rename(cell_type = X) |>
    ### Factor cell type
    mutate(
        cell_type = factor(
            cell_type,
            levels = c(
                "T/NK cell", "myeloid", "B cell", "granulocyte",
                "dendritic cell", # "cDC", "pDC",
                "plasma cell", "epithelial", "fibroblast", "endothelial"
            )
        )
    ) |>
    left_join(sample_info, by = "sample")

### Plot
celltype_sample_prop |>
    as_tibble() |>
    ggplot(aes(x = sample, y = percentage, fill = cell_type)) +
    geom_bar(stat = "identity") +
    theme(
        axis.title.x = element_blank(),
        axis.title.y = element_blank(),
        panel.background = element_blank(),
        axis.text.x = element_text(angle = 30)
    ) +
    # coord_flip()+
    ggtitle("Sample composition by cell type")

### Cell type proportions by IE1 vs IE2
stat_res <- celltype_sample_prop |>
    group_by(cell_type) |>
    wilcox_test(percentage ~ IE) |>
    add_significance() |>
    add_xy_position(x = "cell_type")

ggplot(celltype_sample_prop, aes(x = IE, y = percentage, fill = IE)) +
    geom_boxplot() +
    geom_point() +
    facet_wrap(~ cell_type, scales = "free", ncol = 5, strip.position = "bottom") +
    theme(
        axis.ticks.x = element_blank(),
        axis.text.x = element_blank(),
        axis.title.x = element_blank()
    ) +
    # theme(panel.background = element_blank())+
    ylab("proportion")
    # stat_pvalue_manual(stat_res, hide.ns = TRUE)
Cytof vs 10x Cell type
## Cytof cell type percentages
cytof_dir <- here("projects/2023_NC_BCexh/BCexh_scRNAseq/03_Additional_files")
cytof_perc <- read.csv(
    here(cytof_dir, "cytof_celltype_prop.csv")
) |>
    pivot_longer(
        starts_with("TBB"), names_to = "sample", values_to = "percentage"
    ) |>
    rename(cell_type = cell_type) |>
    left_join(sample_info, by = "sample") |>
    mutate(method = "cytof")

ggplot(cytof_perc, aes(sample, y = percentage, fill = cell_type)) +
    geom_bar(stat = "identity") +
    theme(axis.title.x = element_blank(), axis.title.y = element_blank()) +
    # coord_flip()+
    theme(panel.background = element_blank()) +
    ggtitle("CyTOF percentages")

### Adapt 10x celltypes to fit CyTOF celltypes
# merged_post_filter$cell_type <- factor(
#     merged_post_filter$cell_type,
#     levels = c(
#         "T/NK cell",
#         "myeloid",
#         "B cell",
#         "dendritic cell",
#         "granulocyte",
#         "plasma cell",
#         "epithelial",
#         "endothelial",
#         "fibroblast"
#         # "cDC",
#         # "pDC"
#     )
# )
celltype_sample_prop |>
    ggplot(aes(sample, y = percentage, fill = cell_type)) +
    geom_bar(stat = "identity") +
    theme(axis.title.x = element_blank(), axis.title.y = element_blank()) +
    # coord_flip()+
    theme(panel.background = element_blank()) +
    ggtitle("10x percentages")

### Combine cytof and 10x percentages
celltype_pct <- bind_rows(
    cytof_perc,
    celltype_sample_prop |> mutate(method = "10x")
)

celltype_pct$cell_type <- factor(
    celltype_pct$cell_type,
    levels = c(
        "T/NK cell", "myeloid", "B cell", "dendritic cell", "granulocyte",
        "plasma cell", "epithelial", "endothelial", "fibroblast", "other"
    )
)

celltype_pct$method <- factor(celltype_pct$method, levels = c("cytof", "10x"))
celltype_pct <- celltype_pct |> drop_na()

ggplot(celltype_pct, aes(method, y = percentage, fill = cell_type)) +
    geom_bar(stat = "identity") +
    facet_wrap(~sample, ncol = 6) +
    theme(
        axis.title.x = element_blank(),
        axis.title.y = element_blank(),
        panel.background = element_blank()
    ) +
    # coord_flip()+
    ggtitle('Celltype percentages: CyTOF vs. scRNA-seq')
Inspect some chemokine features
CCLs <- paste0("CCL", c(1:28))
CX_XCs <- c(paste0("CXCL", c(1:17)), "CXCL4L1", "XCL1", "XCL2", "CX3CL1")
ILs  <- paste0("IL", c(1:33))
other_cytokines <- c(
    "TNF", "IFNG", "IFNA1", "IFNB1", "TGFB1", "CSF1", "CSF2", "CSF3", "EPO"
)
interaction_other <- c(
    "CD47", "SIRPG", "SIRPA", "FASLG", "FAS", "CD80", "CD86", "CTLA4"
)
cytokine_receptor <- c(
    'CCR1', 'CCR2', 'CCR3', 'CCR4', 'CCR5', 'CCR6', 'CCR7', 'CCR8', 'CCR9',
    'CCR10', 'CCR11', 'IL10RA', 'IL4R', 'CXCR1', 'CXCR2', 'CXCR3', 'CXCR4',
    'CXCR5', 'CXCR6', 'CXCR7'
)

# example_data <- readRDS(here(output_path, ""))
VlnPlot(
    merged_post_filter, features = c("nFeature_RNA"), pt.size = 0
) +
NoLegend()
# theme(legend.position = "right") +
# guides(fill = guide_legend(ncol = 2))

DotPlot(merged_post_filter, features = c("PTPRC", "CD3E", "CD14", "CD68"))
FeaturePlot(merged_post_filter, features = c("nFeature_RNA", "nCount_RNA"))
Chemkine expression per cell type
chemokines <- c(
    "CXCL9", "CXCL10", "CXCL13", "CCL4", "CCL5", "CCL3", "CXCL8",
    "CCL17", "CCL22"
)

chemokine_tab <- data.frame(celltype = merged_post_filter$cell_type)

### Seurat V5, the counts data do not have colnames and rownames
counts <- merged_post_filter@assays$RNA@layers$counts
rownames(counts) <- Features(merged_post_filter)
colnames(counts) <- Cells(merged_post_filter)

for (i in chemokines) {
    chemokine_tab[, i] <- ifelse(counts[i, ] > 0, 1, 0)
}

chemokine_add  <-  data.frame(celltype = unique(chemokine_tab$celltype))

for (i in chemokines) {
    count_i <- as.data.frame(
        table(chemokine_tab$celltype, chemokine_tab[, i])[, "1"]
    )
    colnames(count_i) <- i
    count_i$celltype <- rownames(count_i)
    chemokine_add <- merge(chemokine_add, count_i, by = "celltype")
}
Save immune subsets
### Load data
merged_post_filter <- readRDS(here(output_path, "merged_complete_umap.rds"))

### Immune subset
immune <- subset(
    merged_post_filter,
    idents = c(
        "T/NK cell",
        "myeloid",
        "B cell",
        "granulocyte",
        # "dendritic cell",
        # "cDC",
        "pDC",
        "plasma cell"
    )
)
saveRDS(immune, here(output_path, "immune.rds"), compress = "xz")
rm(immune)

## T/NK cell subset
TNK <- subset(merged_post_filter, idents = "T/NK cell")
saveRDS(
    TNK,
    here(output_path, "T_NK_cells.rds"),
    compress = "xz"
)
rm(TNK)

### Myeloid subset (incl. DCs)
myeloid <- subset(
    merged_post_filter, idents = c(
        "myeloid",
        "dendritic cell"
        # "cDC",
        # "pDC"
    )
)
saveRDS(myeloid, here(output_path, "myeloid_inclDC.rds"), compress = "xz")
rm(myeloid)

### B cell subset
B <- subset(merged_post_filter, idents = "B cell")
saveRDS(B, here(output_path, "B_cells.rds"))
rm(B)

### Plasma cell subset
PC <- subset(x = merged_post_filter, idents = "plasma cell")
saveRDS(PC, here(output_path, "plasma_cells.rds"))
rm(PC)

### Granulocyte subset
gran <- subset(x = merged_post_filter, idents = "granulocyte")
saveRDS(gran, here(output_path, "granulocytes.rds"))
rm(gran)

### tumor cell subset
ep <- subset(x = merged_post_filter, idents = "epithelial")
saveRDS(ep, here(output_path, "epithelial.rds"))
rm(ep)

### fibroblast subset
fib <- subset(x = merged_post_filter, idents = "fibroblast")
saveRDS(fib, here(output_path, "fibroblast.rds"))
rm(fib)

### endothelial cell subset
endo <- subset(x = merged_post_filter, idents = "endothelial")
saveRDS(endo, here(output_path, "endothelial.rds"))
rm(endo)
T cells subclustering
Process T cells subset
### Load T cells subset
path <- here("projects/2023_NC_BCexh/BCexh_scRNAseq/output")
run1_Tcell <- readRDS(here(path, "T_NK_cells.rds"))
### 6,77GB is too big for running
lobstr::obj_size(run1_Tcell)

### Use subset data example
Tcell <- subset(
    run1_Tcell,
    subset = sample == c(
        "TBB011", "TBB165", "TBB338", "TBB075", "TBB330", "TBB214")
    )
lobstr::obj_size(Tcell)
rm(run1_Tcell)

### Store Keratin and MGP percentage in object meta data
Tcells <- PercentageFeatureSet(
    Tcells, pattern = "^KRT", col.name = "percent_krt"
)
Tcells <- PercentageFeatureSet(
    Tcells, pattern = "MGP", col.name = "percent_MGP"
)
colnames(Tcells[[]])

### Run Normalization, ScaleData, and FindVariableFeatures
Tcells <- SCTransform(
    Tcells,
    vars.to.regress = c("percent_mito", "percent_krt", "percent_MGP"),
    verbose = TRUE
)

### Dimensional reduction
Tcells <- RunPCA(Tcells, verbose = FALSE)
Tcells <- RunUMAP(Tcells, dims = 1:15)
Tcells <-  FindNeighbors(Tcells, dims = 1:15)
Tcells <- FindClusters(Tcells, resolution = 1)

### Save object
saveRDS(
    Tcells, here(path, "Tcells.rds"),
    compress = "xz"
)
### Load T cells subset
path <- here("projects/2023_NC_BCexh/BCexh_scRNAseq/output")
Tcells <- readRDS(here(path, "Tcells.rds"))
colnames(Tcells[[]])
ElbowPlot(Tcell, ndims = 25)
# VizDimLoadings(Tcell, dims = 1:2)
# PCAPlot(Tcell)
# DimHeatmap(Tcell, dims = 15:20, cells = 500, balanced = TRUE)
DimPlot(Tcell, reduction = "umap", label = TRUE)
DimPlot(Tcell, reduction = "umap", group.by = "sample")
DimPlot(Tcell, reduction = "umap", group.by = "sample")
### Clustree analysis
# clustree(Tcell, prefix = "SCT_snn_res.") +
# scale_edge_color_continuous(low = "black", high = "black")
### QC plots
VlnPlot(
Tcell,
features = c("nFeature_RNA", "nCount_RNA", "percent_mito"),
ncol = 1, pt.size = 0, sort = FALSE
)
VlnPlot(
Tcell,
features = c("percent_krt", "percent_MGP"),
pt.size = 0, sort = FALSE, ncol = 1
)
DimPlot(Tcell, group.by = "Tcell_cluster")
DimPlot(Tcell, group.by = "Tcell_metacluster")
DimPlot(Tcell, group.by = "SCT_snn_res.1")
FeaturePlot(Tcell, features = c("PDCD1", "CD4", "CD8A", "FOXP3"))
VlnPlot(Tcell, features = c("MKI67"), pt.size = 0, sort = FALSE)
### Highlight individual clusters
Idents(Tcell) <- Tcell$Tcell_metacluster
cells_CD4ex <- WhichCells(
Tcell, ident = c("CD4_exhausted", "CD8_exhausted")
)
DimPlot(Tcell, reduction = "umap", cells.highlight = cells_CD4ex)Cluster proportions
### Load processed data
Tcell_dir <- here("projects/2023_NC_BCexh/BCexh_scRNAseq/output/Tcells")
fs::dir_create(Tcell_dir)

### Extract group info
sample_info <- Tcells[[]] |>
    select(sample, IE) |>
    distinct()

### Which cluster is each sample made of? (by cluster)
cluster_samples_count <- table(Tcells$SCT_snn_res.1, Tcells$sample) |>
    as.data.frame() |>
    as_tibble() |>
    dplyr::rename(cluster = Var1, sample = Var2, prop = Freq)
# write.csv(
#     cluster_samples_count,
#     here(Tcell_dir, "cluster_samples_count.csv"),
#     row.names = TRUE
# )
ggplot(cluster_samples_count, aes(sample, y = prop, fill = cluster)) +
    geom_bar(stat = "identity") +
    theme(axis.title.x = element_blank(), axis.title.y = element_blank()) +
    coord_flip() +
    theme(panel.background = element_blank()) +
    ggtitle("Sample composition (T/NK clusters)")


### How many cells of each sample in each cluster? (by sample)
cluster_samples_prop <- prop.table(
    table(Tcells$SCT_snn_res.1, Tcells$sample),
    margin = 1
) |>
    as.data.frame() |>
    as_tibble() |>
    dplyr::rename(cluster = Var1, sample = Var2, prop = Freq)
# write.csv(
#     cluster_samples_prop,
#     here(Tcell_dir, "cluster_samples_proportion.csv"),
#     row.names = TRUE
# )
ggplot(cluster_samples_prop, aes(cluster, y = prop, fill = sample)) +
    geom_bar(stat = "identity") +
    theme(
        axis.title.x = element_blank(),
        axis.title.y = element_blank(),
        panel.background = element_blank()
    ) +
    # coord_flip()+
    ggtitle("T/NK cell cluster composition")

### How many cells of each IE are in each cluster
cluster_IE_count <- table(Tcells$SCT_snn_res.1, Tcells$IE) |>
    as.data.frame() |>
    as_tibble() |>
    dplyr::rename(cluster = Var1, IE = Var2, count = Freq)
ggplot(cluster_IE_count, aes(cluster, y = count, fill=IE)) +
  geom_bar(stat="identity")+
  theme(axis.title.x=element_blank(), axis.title.y = element_blank())+
  #coord_flip()+
  theme(panel.background = element_blank())+
  ggtitle("T/NK cell cluster composition")

### What percentage of each IE is in which cluster?
cluster_IE_prop <- prop.table(
    table(Tcells$SCT_snn_res.1, Tcells$IE),
    margin = 1
) |>
    as.data.frame() |>
    as_tibble() |>
    dplyr::rename(cluster = Var1, IE = Var2, prop = Freq)
ggplot(cluster_IE_prop, aes(cluster, y = prop, fill = IE)) +
    geom_bar(stat = "identity", position = "dodge") +
    theme(axis.title.x = element_blank(), axis.title.y = element_blank()) +
    # coord_flip()+
    theme(panel.background = element_blank()) +
    ggtitle("Proportion of each TIG belonging to a specific cluster")

ggplot(cluster_IE_prop, aes(x = IE, y = prop, fill = IE)) +
    geom_boxplot() +
    geom_point() +
    facet_wrap(
        ~ cluster, scales = "free",
        ncol = 3,
        strip.position = "bottom"
    ) +
    theme(
        axis.title.x = element_text("cluster"),
        axis.text.x = element_blank(),
        axis.ticks.x = element_blank()
    ) +
    # theme(panel.background = element_blank())+
    xlab("cluster")
Finding cluster DEG
Idents(Tcells) <- Tcells$SCT_snn_res.1
Tcells_markers <- FindAllMarkers(
    Tcells, only.pos = TRUE, min.pct = 0.25, logfc.threshold = 0.25
)
marker_genes_top10 <- Tcells_markers |>
    group_by(cluster) |>
    slice_max(avg_log2FC, n = 10)
### Feature list
features <- c("FOXP3", "CCL18", "IL2RA")
features_cytof <- c(
'CD3E', 'CD8A', 'CD4', 'FOXP3', 'HAVCR2', 'PDCD1', 'CTLA4', 'ICOS',
'IL2RA', 'PTPRC', 'CD68', 'CD14', 'CD274', 'CCR7', 'HLA-DRA', 'MRC1',
'SIGLEC1', 'MSR1', 'CD163', 'FCGR2A', 'FCGR2B', 'FCGR2C', 'FCGR1A',
'ITGAM', 'ITGAX', 'FCGR3A', 'CD93', 'IL3RA', 'CD86', 'CD36', 'CD38',
'CCR2', 'SLAMF7'
)
features_cytof_T_01 <- c('CD3E', 'CD8A', 'FOXP3', 'HAVCR2', 'PDCD1', 'CTLA4')
features_cytof_T_02 <- c('ICOS', 'IL2RA', 'PTPRC', 'CD4', 'CCR7', 'CD38')
features_cytof_T <- c(
'CD3E', 'CD8A', 'FOXP3', 'HAVCR2', 'PDCD1', 'CTLA4', 'ICOS', 'IL2RA',
'PTPRC', 'CD4', 'CCR7', 'CD38', 'NCAM1'
)
features_T_extended <- c(
'CD3E', 'CD8A', 'FOXP3', 'HAVCR2', 'PDCD1', 'CTLA4', 'ICOS', 'IL2RA',
'PTPRC', 'CD4', 'CCR7', 'CD38', 'NCAM1', 'ENTPD1', 'ITGAE', 'SELL',
'CD40LG', "FCGR3A", "CD27", "IL7R", "HLA-DRA", "TBX21", "CD69", "NCR1",
"IRF4"
)
cytokine <- c(
'CCL20', 'CCL22', 'CXCL2', 'CXCL3', 'CXCL8', 'CCL8', 'CCL18', 'CCL2',
'CCL3', 'CCL4', 'CCL4L2', 'CCL5', 'CXCL10', 'CXCL12', 'CCL13', 'CXCL1',
'CXCL13', "IL4", "IL13", "IFNG", "TNF"
)
chemokine_01 <- c('CCL20', 'CCL22', 'CXCL2', 'CXCL3', 'CXCL8')
chemokine_02 <- c('CCL8', 'CCL18', 'CCL2', 'CCL3', 'CCL4')
chemokine_03 <- c('CCL4L2', 'CXCL10', 'CXCL12', 'CCL13', 'CXCL1')
cytokine_receptor <- c(
'CCR1', 'CCR10', 'CCR2', 'CCR7', 'CCR4', 'CCR5', 'CCR6', 'IL10RA',
'IL4R', 'CXCR2', 'CXCR3', 'CXCR4', 'CXCR5', 'CCR8'
)
TF <- c(
'IRF2', 'IRF5', 'IRF8', 'IRF9', 'IRF4', 'IRF7', 'STAT1', 'STAT2', 'STAT4',
'TCF12', 'TCF19', 'BCL6', 'ZBTB31', 'ZBTB33', 'ZBTB47', 'CIITA'
)
features_plitas <- c(
'CCR8', 'CCR10', 'CX3CR1', 'IL1RL1', 'IL2RA', 'IL1R2', 'TNFRSF8',
'TNFRSF4', 'TNFRSF9', 'TNFRSF18', 'CD177', 'CARD16'
)
Th1 <- c(
'CCL4', 'CD38', 'CXCL9', 'CXCL10', 'CXCL11', 'FN1', 'GNLY', 'GZMA',
'GZMB', 'IFNA', 'IFNG', 'IL2', 'IL8', 'IL10', 'IL12B', 'IL18', 'LTA',
'MAP3K8', 'OSM', 'STAT1', 'STAT4', 'TBX21', 'TIA1', 'TNF'
)
Th2 <- c(
'GATA3', 'IL4', 'IL5', 'IL10', 'IL13', 'MAF', 'STAT5A', 'STAT5B', 'STAT6'
)
Th17 <- c(
'BATF', 'CCL20', 'IL1A', 'IL1B', 'IL6', 'IL17A', 'IL17F', 'IL18', 'IL21',
'IL22', 'LTA', 'RORC', 'STAT3', 'TGFB1', 'TGFB2', 'TGFB3'
)
tumor_reactive <- c(
"PDCD1", "LAG3", "HAVCR2", "TNFRSF9", "TNFRSF18", "ENTPD1", "ITGAE",
"CXCL13", "IRF4", "BATF"
)
cytotoxic <- c(
"GZMB", "GZMA", "GZMK", "TNF", "IFNG", "GNLY", "FASLG", "IL2"
)
M1M2_rec <- c(
"IL10RA", "IL10RB", "CXCR3", "CCR4", "CCR1", "CCR5", "IGF2R", "TFGBR2",
"TGFBR1", "TGFBR3", "ITGAV", "ITGA5", "LRP8", "LRP1", "SCARB1", "C3AR1"
)
M1M2_lig <- c(
"CALM1", "CALM2", "CALM3", "TGFB1", "TLN1", "HSP90AA1", "VEGFA", "GNAI2",
"PGF", "MDK", "FGF2"
)Correlation matrix
Idents(Tcells) <- Tcells$SCT_snn_res.1
cluster_perc <- prop.table(table(Idents(Tcells), Tcells$sample), margin = 2)
cluster_perc <- t(cluster_perc)
corr <- cor(cluster_perc)

### For metaclusters
T_mcluster_perc <- prop.table(
    table(Tcells$Tcell_metacluster, Tcells$sample), margin = 2
)
T_mcluster_perc <- t(T_mcluster_perc)

### Plot
corrplot(
    corr, method = "color", type = "upper", tl.srt = 0, tl.offset = 1,
    tl.cex = 1, tl.col = "black", title = "Tcell cluster correlations"
)

# compute p-values
p_corr <- cor.mtest(corr, method = "pearson")
p_corr2 <- p_corr[[1]]


### Plot with p-values below zero in white
corrplot(
    corr, method = "color", type = "upper", tl.srt = 0, tl.col = "black", tl.offset = 1, p.mat = p_corr2,
    sig.level = 0.005, insig = "label_sig",
    pch = "*", pch.cex = 1, title = "Tcell cluster correlations (P<0.05)"
)
CD4/CD8 ratio
# Idents(Tcells) <- Tcells$Tcell_metacluster
# levels(Idents(Tcells))
# T_only <- subset(
#     Tcells, idents = c("NKT", "NK_activated", "NK", "proliferating"),
#     invert = TRUE
# )

# cluster_averages <- AverageExpression(T_only, return.seurat = TRUE)
# dim(cluster_averages)
# dim(cluster_averages_df)
# rownames(cluster_averages_df) <- rownames(cluster_averages)
# cluster_averages_df <- as.data.frame(cluster_averages@assays$RNA@layers$counts)
# colnames(cluster_averages_df)
# colnames(cluster_averages)

# CD8_CD4_df <- as.data.frame(
#     t(cluster_averages_df[c("CD8A", "CD8B", "CD4"), ])
# )
# CD8_CD4_df$cluster <- rownames(CD8.CD4.df)
# CD8.CD4.df <- mutate(CD8.CD4.df, ratio = (CD8A + CD8B) / 2 / CD4)

# p <- ggplot(CD8.CD4.df, aes(cluster, ratio)) +
#     geom_point() +
#     ylab("CD8/CD4 ratio") +
#     theme(panel.background = element_blank(),
#         panel.border = element_rect(color = "black", fill = NA, size = 1))
T cells EdgeR pseudobulk
### Cluster-indepenent IE comparsion
samples <- c("TBB011", "TBB165", "TBB338", "TBB075", "TBB214", "TBB330")
raw_counts <- as.data.frame(Tcells@assays$RNA@layers$counts)
dim(raw_counts)
Assays(Tcells)
colnames(raw_counts) <- colnames(Tcells)
rownames(raw_counts) <- rownames(Tcells[["RNA"]])

### Get the counts matrix
raw_counts$TBB011 <- rowSums(raw_counts[,grep("TBB011", names(raw_counts))])
raw_counts$TBB165 <- rowSums(raw_counts[,grep("TBB165", names(raw_counts))])
raw_counts$TBB338 <- rowSums(raw_counts[,grep("TBB338", names(raw_counts))])
raw_counts$TBB075 <- rowSums(raw_counts[,grep("TBB075", names(raw_counts))])
raw_counts$TBB330 <- rowSums(raw_counts[,grep("TBB330", names(raw_counts))])
raw_counts$TBB214 <- rowSums(raw_counts[,grep("TBB214", names(raw_counts))])

raw_sums <- raw_counts[, samples]
write.csv(raw_sums, here(Tcell_dir, "sample_sum_counts.csv"), row.names = TRUE)
### Load count data
scrna_dir <- here("projects/2023_NC_BCexh/BCexh_scRNAseq")
counts <- read.csv(here(Tcell_dir, "sample_sum_counts.csv"), row.names = "X")
colnames(counts)
### Get group information
clinical_data <- read_csv(
here(scrna_dir, "03_Additional_files/clinical_data.csv"),
show_col_types = FALSE
) |> mutate(sample = str_glue("T{Patient_ID}")) |>
dplyr::filter(sample %in% samples) |>
relocate(sample, IE, .before = Patient_ID) |>
arrange(IE)
### Preapre a DGElist object
obj <- edgeR::DGEList(
counts = counts, group = clinical_data$IE, samples = clinical_data
)
### Filter out lowly expressed genes
keep <- edgeR::filterByExpr(
obj, group = clinical_data$IE,
min.count = 30, min.total.count = 300, large.n = 4, min.prop = 0.6
)
table(keep)
obj <- obj[keep, , keep.lib.sizes = FALSE]
### Normalisation for RNA composition using TMM (trimmed mean of M-values)
obj <- edgeR::calcNormFactors(obj)
obj$samples
### Setup the design matrix
sample <- factor(clinical_data$sample)
IE <- factor(clinical_data$IE)
IE <- relevel(IE, "IE2")
design <- model.matrix(~IE)
### Estimate dispersion (estimates common dispersion, trended dispersions and
### tagwise dispersions in one run)
obj <- estimateDisp(obj, design)
plotBCV(obj)
### Calcualte differential expression
### exact test (only for single-factor experiments)
et <- exactTest(obj)
topTags(et)
### Number of up/downregulated genes at 5% FDR
summary(decideTests(et))
plotMD(et)
abline(h=c(-1,1), col ="blue")
### Export results
write.csv(
as.data.frame(topTags(et, n=Inf)),
here(Tcell_dir, "IE1vsIE2_EdgeR_samplesums_exactT_filtered.csv")
)Figure1
UMAP plots
path <- here("projects/2023_NC_BCexh/BCexh_scRNAseq")
all_merged <- readRDS(here(path, "output/merged_complete_umap.rds"))
colnames(all_merged[[]])

### Color palette
colors <- hue_pal()(50)
show_col(colors)

### Classify pDCs as myeloid cells for this large overview
unique(all_merged[[]]$cell_type)
all_merged$cell_type <- factor(all_merged$cell_type)
ct_levels <- levels(all_merged$cell_type)
ct_levels[6] <- "mast cell/basophil"
levels(all_merged$cell_type) <- ct_levels

### Reorder patient levels
all_merged$sample <- factor(all_merged$sample)

### Subset to very few cells to get small pdfs
cells <- WhichCells(all_merged)
cells_sub <- sample(cells, 100)
object <- subset(all_merged, cells = cells_sub)

### Color by celltype
umap_celltype <- DimPlot(
    object, group.by = "cell_type",
    cols = c(
        "#FF5F50", "darkorange2", "gold3", "#77C900", "#00AA5C", "#00C0BD", "#1F99FF", "#0044DB", "gray")
) +
    theme_void()

### Color by sample
umap_patient <- DimPlot(object, group.by = "sample") +
    theme_void()

umap_celltype +  umap_patient

### Color by sample group
umap_IE <- DimPlot(object, group.by = "IE") +
    theme_void()

### Color by clusters
DimPlot(all_merged, group.by = "RNA_snn_res.2", label = TRUE) +
    theme_void()
Highlight fibroblast
Idents(all_merged) <- all_merged$cell_type
fibroblasts  <-  WhichCells(object = all_merged, ident = c("fibroblast"))
DimPlot(
    all_merged, reduction = "umap", cells.highlight = fibroblasts,
    cols.highlight = "#00C1AA", sizes.highlight = 0.7, pt.size = 0.7
)
Feature plots
### save as png (Inkscape/Illustrator cannot handle UMAPs with lots of cells)
genes <- c("PTPRC", "PDGFRB", "CD3E", "CD14", "EPCAM", "PECAM1")
FeaturePlot(all_merged, genes, max.cutoff = 3) + theme_void()

### save one plot as pdf to get vectorized legend (with very few cells)
cells <- WhichCells(all_merged)
cells_sub <- sample(cells, 1000)
obj_sub <- subset(all_merged, cells = cells_sub)
FeaturePlot(obj_sub, "HLA-DRA", max.cutoff = 3)
Dotplots for lineage markers
### Features
genes <- c(
    "EPCAM", "CDH1", "PECAM1", "CAV1", "VWF", "PDGFRB", "FAP", "PTPRC", "CD3E", "NCAM1", "CD14", "HLA-DRA", "ITGAX", "MS4A1", "MS4A2", "IGKC"
)
genes_PDL1 <- c("CD274", "LAMP3", "CCR7")

### Main cell types only
Idents(all_merged) <- all_merged$cell_type
DotPlot(all_merged, features = genes_PDL1) +
    coord_flip() +
    theme(
        axis.text.x = element_text(angle = 90, hjust = 1),
        axis.title.x = element_blank(),
        axis.title.y = element_blank()
    )

### all clusters
Idents(all_merged) <- all_merged$RNA_snn_res.2
DotPlot(all_merged, features = genes_PDL1) +
    coord_flip() +
    theme(
        axis.text.x = element_text(angle = 90, hjust = 1),
        axis.title.x = element_blank(),
        axis.title.y = element_blank()
    )
Gene expression heatmap
Idents(all_merged) <- all_merged$cell_type
cluster_averages_table <- AverageExpression(
    all_merged, return.seurat = FALSE, assays = "RNA"
)

RNA_average <- as.matrix(cluster_averages_table[[1]])

### Normalize between 0 and 1
RNA_average_norm <- apply(
    RNA_average, 1, function(x) (x - min(x)) / (max(x) - min(x))
)
RNA_average_znorm <- apply(RNA_average, 1, function(x) (x - mean(x)) / sd(x))

T_supp <- c(
    "CD274", "PDCD1LG2", "IDO1", "CD80", "CD86", "CCL17", "CCL19", "CCL22", "IL15"
)

Heatmap(
    t(subset(RNA_average_norm, select = T_supp)),
    show_row_names = TRUE,
    row_dend_side = "left",
    heatmap_legend_param = list(title = "Normalized\nmean counts"),
    col = viridis(100),
    cluster_rows = FALSE,
    cluster_columns = FALSE,
    row_names_side = "left",
    column_names_side = "top",
    column_names_rot = 90,
    column_dend_side = "bottom",
    row_names_gp = gpar(fontsize = 6),
    cluster_column_slices = FALSE
)
Cell type frequence
### Full clusters by sample
cluster_prop <- as.data.frame(
    prop.table(
        table(all_merged$sample, all_merged$RNA_snn_res.2), margin = 2
    )
)
colnames(cluster_prop) <- c("sample", "cluster", "proportion")

ggplot(cluster_prop, aes(cluster, y = proportion, fill = sample)) +
    geom_bar(stat = "identity") +
    theme(axis.title.x = element_blank(), axis.title.y = element_blank(), axis.ticks.x = element_blank()) +
    # coord_flip()+
    theme(panel.background = element_blank(), axis.text.x = element_text(angle = 90, hjust = 1)) +
    ggtitle("Sample composition by cell type")
### Compare cell type frequencies
celltype_freq <- as.data.frame(table(all_merged$cell_type, all_merged$sample))
colnames(celltype_freq) <- c("cell_type", "sample", "cell_number")
### Absolute frequency
ggplot(celltype_freq, aes(sample, y = cell_number, fill = cell_type)) +
geom_bar(stat = "identity") +
theme(axis.title.x = element_blank(), axis.title.y = element_blank(), axis.ticks.x = element_blank()) +
# coord_flip()+
theme(panel.background = element_blank(), axis.text.x = element_text(angle = 90, hjust = 1)) +
ggtitle("Sample composition by cell type (absolute)") ## Figure2
### Relative frequency
celltype_prop <- as.data.frame(
prop.table(table(all_merged$cell_type, all_merged$sample), margin = 2)
)
colnames(celltype_prop) <- c("cell_type", "sample", "proportion")
ggplot(celltype_prop, aes(sample, y = proportion, fill = cell_type)) +
geom_bar(stat = "identity") +
theme(axis.title.x = element_blank(), axis.title.y = element_blank(), axis.ticks.x = element_blank()) +
# coord_flip()+
theme(
panel.background = element_blank(),
axis.text.x = element_text(angle = 90, hjust = 1)
) +
ggtitle("Sample composition by cell type")
### Cell type proporations by sample group
celltype_prop <- celltype_prop |>
left_join(sample_info, by = "sample")
ggplot(celltype_prop, aes(x = IE, y = proportion, color = IE)) +
geom_boxplot() +
geom_point() +
facet_wrap(~cell_type, scales = "fixed", ncol = 4, strip.position = "top") +
theme(
axis.ticks.x = element_blank(),
axis.text.x = element_text(angle = 90, hjust = 1),
axis.title.x = element_blank(),
panel.background = element_blank(),
panel.border = element_rect(color = "black", fill = NA, linewidth = 1),
strip.background = element_blank(),
legend.background = element_blank()
) +
ylab("Of total [%]")Cytof vs 10x
Cell numbers before and after filtering
cell_numbers <- read.csv(
    here(path, "03_Additional_files/CellsPerSample_PrePostFilter.csv")
)[-15, -4]

cell_numbers$preFilter <- cell_numbers$preFilter - cell_numbers$postFilter
cell_numbers <- cell_numbers |>
    pivot_longer(
        matches("Filter"), names_to = "filter", values_to = "cell_number"
    ) |>
    mutate(
        filter = factor(
            filter, levels = c("preFilter", "postFilter")
        )
    )

ggplot(cell_numbers, aes(Sample, cell_number, fill = filter)) +
    geom_bar(stat = "identity") +
    scale_fill_manual(
        values = c("preFilter" = "dodgerblue", "postFilter" = "green4")
    ) +
    theme(axis.title.x = element_blank(), axis.title.y = element_blank()) +
    theme(axis.ticks.x = element_blank(),
        axis.text.x = element_text(angle = 90, hjust = 1),
        axis.title.x = element_blank(),
        panel.background = element_blank(),
        strip.background = element_blank(),
        legend.background = element_blank()) +
    ylab("Cell number")
Clinical information
df <- read.csv(here(path, "03_Additional_files/subtype_table.csv"))[, -(28:32)]

### Subtype distribution by TIG (stacked barplot)
df$Clinical.Subtype <- factor(
    df$Clinical.Subtype, levels = c("LumA", "LumB", "LumB-HER2", "HER2", "TN")
)
p_type <- ggplot(df, aes(Clinical.Subtype, fill = Tumor.Immune.Group..CyTOF.based.))+
  geom_bar()+
  scale_x_discrete(drop=FALSE)+
  scale_y_continuous(breaks = c(2,4,6,8))+
   theme(axis.title.x=element_blank(),
         axis.title.y = element_blank(),
         panel.background = element_blank(),
         panel.border = element_rect(color = "black", fill = "NA"),
         axis.text.x = element_text(angle = 90, hjust=1),
         legend.title = element_blank(),
         axis.ticks.x = element_blank()) +
  ggtitle("Clinical Subtypes by TIG")

### Age distribution by TIG (boxplots)
p_age <- ggplot(df, aes(x = Tumor.Immune.Group..CyTOF.based., y = Age.at.Surgery))+
  geom_boxplot()+
  geom_point()+
   theme(axis.title.x=element_blank(),
         axis.title.y = element_blank(),
         panel.background = element_blank(),
         panel.border = element_rect(color = "black", fill = "NA"),
         axis.text.x = element_text(angle = 90, hjust=1),
         legend.title = element_blank(),
         axis.ticks.x = element_blank()) +
  ggtitle("Age by TIG")

### Grade distribution by TIG (stacked barplot)
p_grade <- ggplot(df, aes(Grade, fill = Tumor.Immune.Group..CyTOF.based.))+
  geom_bar()+
  scale_x_discrete(drop=FALSE)+
  scale_y_continuous(breaks = c(2,4,6,8))+
   theme(axis.title.x=element_blank(),
         axis.title.y = element_blank(),
         panel.background = element_blank(),
         panel.border = element_rect(color = "black", fill = "NA"),
         axis.text.x = element_text(angle = 90, hjust=1),
         legend.title = element_blank(),
         axis.ticks.x = element_blank()) +
  ggtitle("Grade by TIG")

### Combine plots
(p_type | p_age | p_grade) + plot_layout(guides = "collect")
### Cell type freq distribution by clinical subtype (boxplots)
celltype_prop <- read.csv(
here(path, "03_Additional_files/celltype_prop_sample_v2.csv"),
header = TRUE
) |>
left_join(df, by = "Patient.ID") |>
pivot_longer(
cols = 2:9, names_to = "cell_type", values_to = "proportion"
) |>
relocate(cell_type, proportion, .after = "Patient.ID")
sign_testing <- compare_means(
proportion ~ Clinical.Subtype, data = celltype_prop,
group.by = "cell_type"
)
ggplot(celltype_prop, aes(x = Clinical.Subtype, y = proportion))+
geom_boxplot()+
geom_point()+
facet_wrap(~cell_type, scales="fixed", ncol=4)+
theme(axis.title.x=element_blank(),
axis.title.y = element_blank(),
panel.background = element_blank(),
panel.border = element_rect(color = "black", fill = "NA"),
axis.text.x = element_text(angle = 90, hjust=1),
legend.title = element_blank(),
axis.ticks.x = element_blank(),
strip.background = element_blank()) +
ggtitle("Cell type frequency by subtype")+
scale_y_continuous(limits = c(0,0.7))+
stat_compare_means(comparisons=list(c("LumA", "LumB")), label = "p.signif")
### Cell type freq distribution by grade (boxplots)
sign_testing <- compare_means(
proportion~Grade, data = celltype_prop, group.by = "cell_type")
my_comparisons <- list(c("G1", "G2"), c("G1", "G3"), c("G2", "G3"))
ggplot(celltype_prop, aes(x = Grade, y = proportion))+
geom_boxplot()+
geom_point()+
facet_wrap(~cell_type, scales="fixed", ncol=4)+
theme(axis.title.x=element_blank(),
axis.title.y = element_blank(),
panel.background = element_blank(),
panel.border = element_rect(color = "black", fill = "NA"),
axis.text.x = element_text(angle = 90, hjust=1),
legend.title = element_blank(),
axis.ticks.x = element_blank(),
strip.background = element_blank()) +
ggtitle("Cell type frequency by subtype")+
scale_y_continuous(limits = c(0,0.7))+
stat_compare_means(comparisons = my_comparisons, label = "p.signif")
### Cell type freq by age (correlation plots)
ggplot(celltype_prop, aes(proportion, Age.at.Surgery))+
geom_point()+
facet_wrap(~cell_type, scales = "free", ncol = 4)+
stat_cor()+
theme(panel.background = element_blank(),
panel.border = element_rect(color = "black", fill = "NA"),
strip.background = element_blank()) +
ggtitle("Cell type frequency by age")Figure2
IE1 vs IE2 Volcano Plot
edger <- read.csv(
    here(Tcell_dir, "IE1vsIE2_EdgeR_samplesums_exactT_filtered.csv")
)
edger$logFC <- -(edger$logFC)

### Remove keratins
edger <- filter(edger, !str_detect(X, "^KRT"))
edger$X <- as.character(edger$X)

### Remove all genes with logCPM < 1.5
edger <- filter(edger, logCPM > 1.5)

highlight <- c(
    "HAVCR", "CDK1", "PTMS", "CSF1", "CD55", "GZMB", "PDCD1", "IL13",
    "MKI67", "TNFRSF18", "CD276", "IRF4", "ITGAE", "CD8B", "TCF7",
    "PDCD4", "GPR183", "CAMK1", "HAVCR2", "BATF", "TOX", "CCL3", "CXCR6"
)

edger$color <- as.character(
    ifelse(
        edger$FDR < 0.1 & edger$logFC > 0.5, "#F8766D",
        ifelse(edger$FDR < 0.1 & edger$logFC < -0.5, "#00BFC4", "grey")
    )
)

# Plot with ggplot
ggplot(edger) +
    geom_point(aes(logFC, -log(FDR)), color = edger$color) +
    geom_label_repel(
        data = subset(edger, X %in% highlight), aes(logFC, -log(FDR), label = X), min.segment.length = 0.1
    ) +
    geom_vline(xintercept = 0.5, linetype = "dotted", color = "grey20") +
    geom_vline(xintercept = -0.5, linetype = "dotted", color = "grey20") +
    geom_hline(
        yintercept = -log(0.1), linetype = "dotted", color = "grey20"
    ) +
    theme(
        panel.grid.major = element_blank(),
        panel.grid.minor = element_blank(),
        panel.background = element_blank(),
        panel.border = element_rect(colour = "black", fill = "NA")
    )
IE1 vs IE2 BoxPlot
counts <- read.csv(
    here(Tcell_dir, "sample_sum_counts.csv"),
    row.names = "X"
)
colnames(counts)

###  setup data table ###
rawdat <- data.table::as.data.table(counts)

### Normalize counts by dividing through library size
rawdat_cpm <- apply(counts,2, function(x) (x/sum(x))*1000000)
tdat = t(rawdat_cpm)
trnames <- row.names(tdat)
tdat <- data.table::as.data.table(tdat)
colnames(tdat) = rownames(counts)
tdat[, condition := trnames]
TIG_list <- c(
    "IE1", "IE1", "IE1", "IE2", "IE2", "IE2"
)
tdat[, TIG := TIG_list]

### format the tables
dat = data.table::melt(
    tdat, id.vars=c('condition', 'TIG'), variable.name='gene', value.name = 'cpm' , variable.factor = FALSE
)

# gene list
GOI <- c(
    "BATF", "IRF4", "CD55", "CD46",  "CSF1", "IL13", "CCL3", "CXCR6",
    "TCF7", "TOX"
)

### plot together with edger values
edger$gene <- edger$X
edger$FDR_x = paste0('FDR = ',signif(edger$FDR, digits=3))
edger$p = paste0('p = ',signif(edger$PValue, digits=2))

subset(dat, gene %in% GOI) |>
  merge(edger, by='gene') |>
  ggplot(aes(x=gene,y=cpm,color=TIG))+
  facet_wrap(~gene+FDR_x+p, scales = "free", ncol = 3)+
  geom_boxplot()+
  geom_point(position = position_jitterdodge(jitter.width = 0, jitter.height = 0, dodge.width = 0.75))+
  expand_limits(x=0,y=0)+
  theme_bw()+
  theme(axis.line.x = element_line(colour = "black", size = 0.25),
        axis.line.y = element_line(colour = "black", size = 0.25),
        panel.grid.major = element_blank(),
        panel.grid.minor = element_blank(),
        panel.border = element_rect(colour = "black", fill="NA"),
        panel.background = element_blank(),
        axis.title.x=element_blank(),
        axis.text.x=element_blank(),
        #strip.background = element_blank(),
        axis.ticks.x=element_blank())