ggpubr::show_point_shapes()
## Scale for y is already present.
## Adding another scale for y, which will replace the existing scale.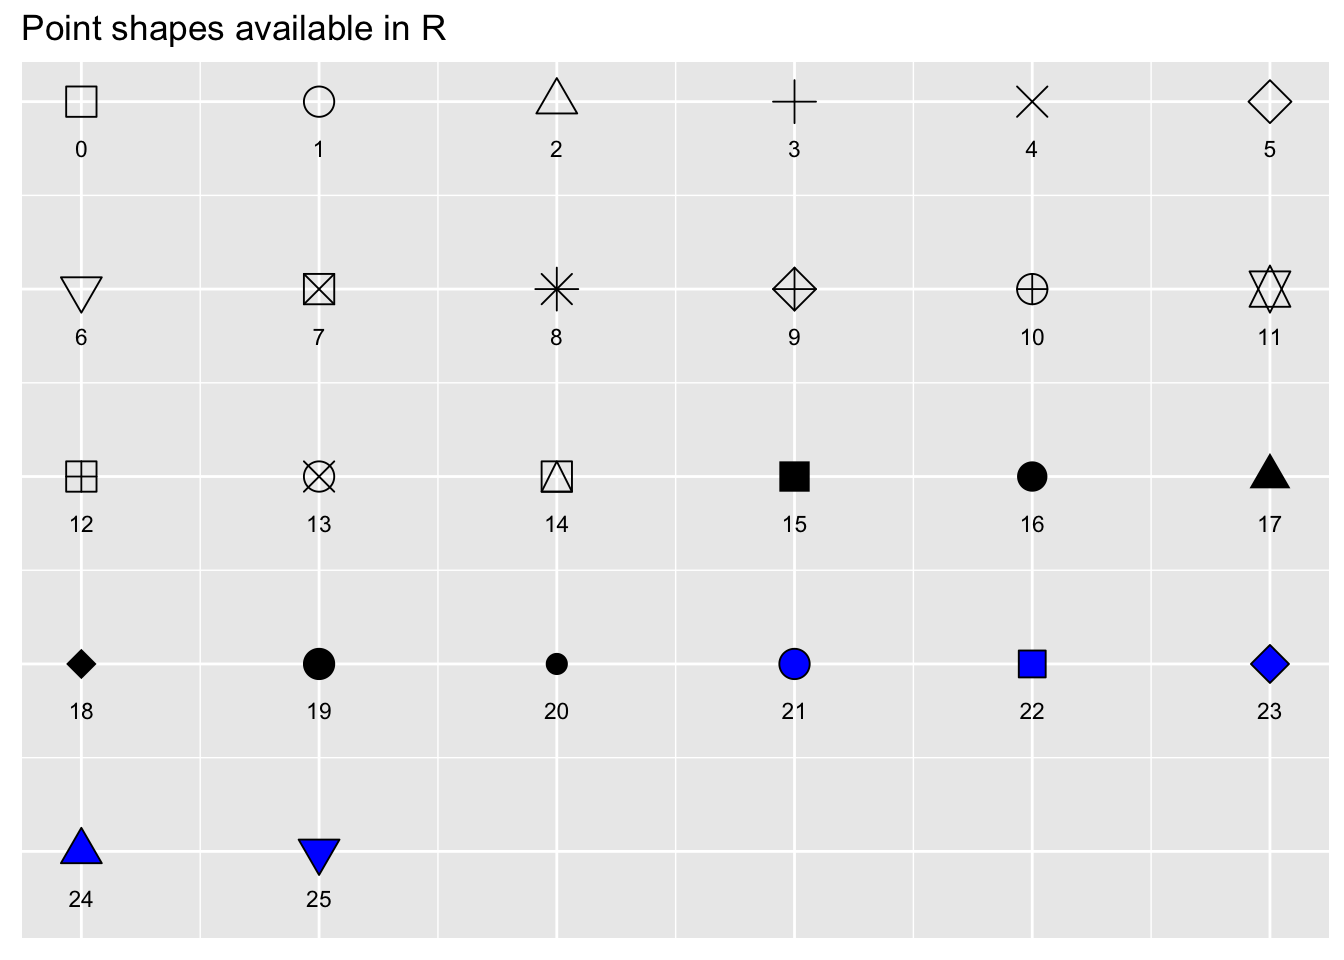
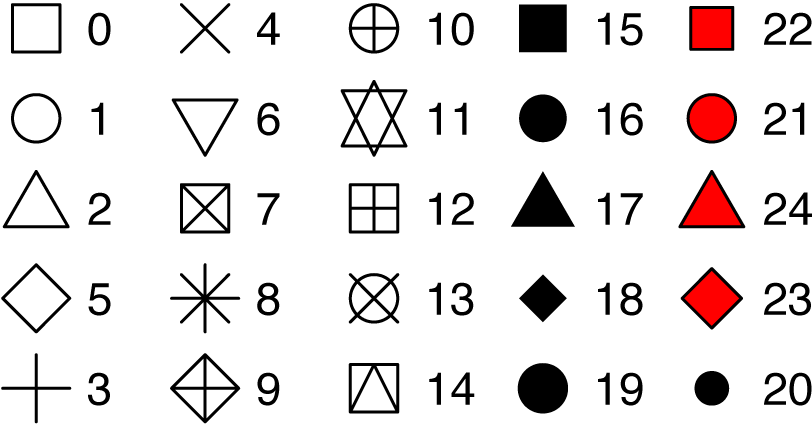 In ggplot, point shapes can be specified in the function geom_point(). Key arguments include:
ggpubr::show_point_shapes()
## Scale for y is already present.
## Adding another scale for y, which will replace the existing scale.
library(ggplot2)
# Change shape, color and size
ggplot(iris, aes(Sepal.Length, Sepal.Width)) +
  geom_point(shape = 18, color = "#FC4E07", size = 3)+
  theme_minimal()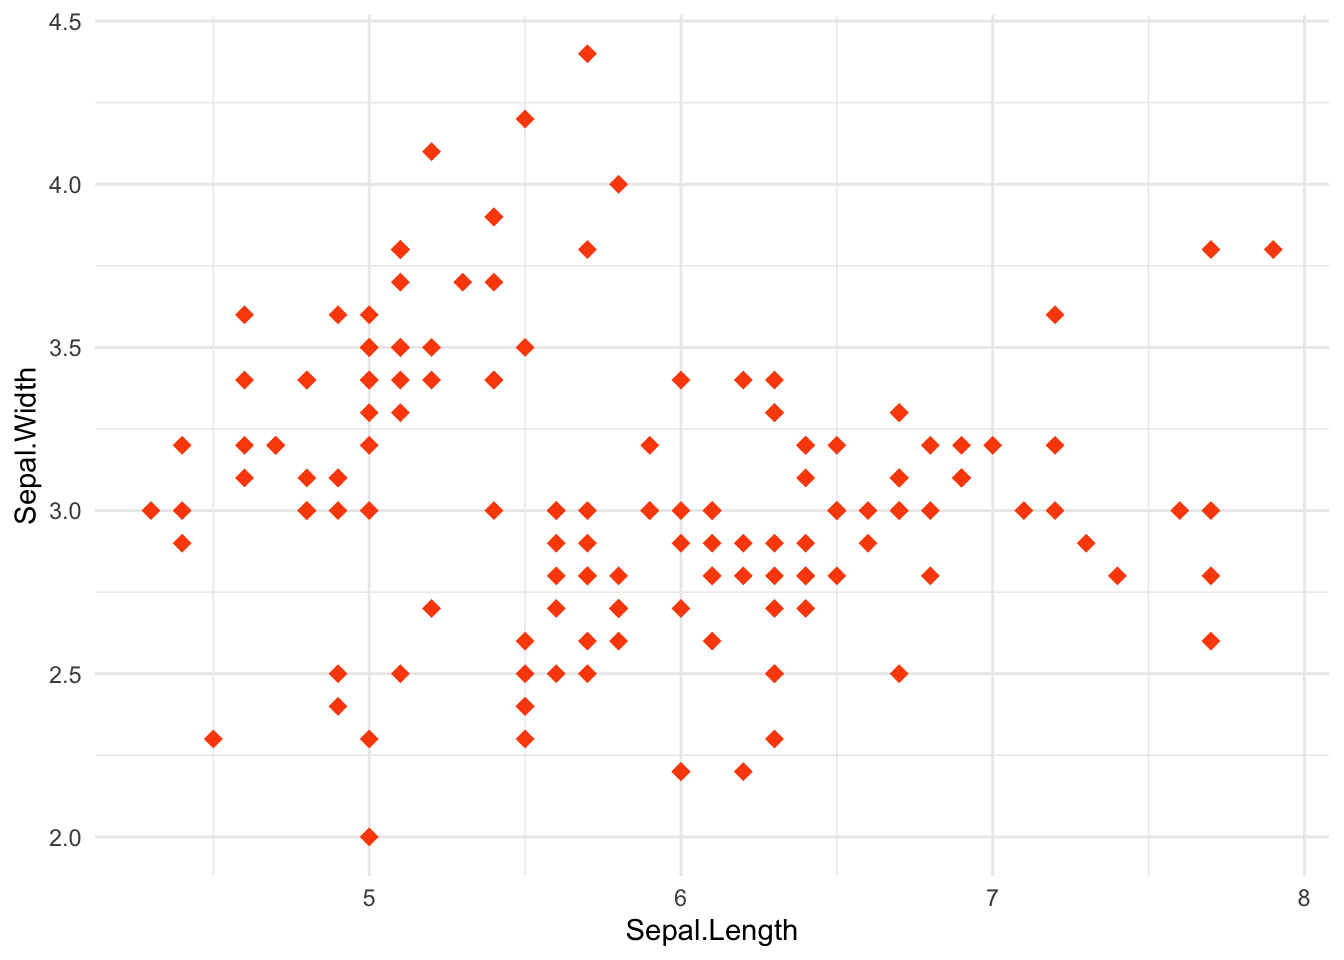
# Change background fill and line color
ggplot(iris, aes(Sepal.Length, Sepal.Width)) +
  geom_point(shape = 21, fill = "lightgray",
             color = "black", size = 3)+
  theme_minimal()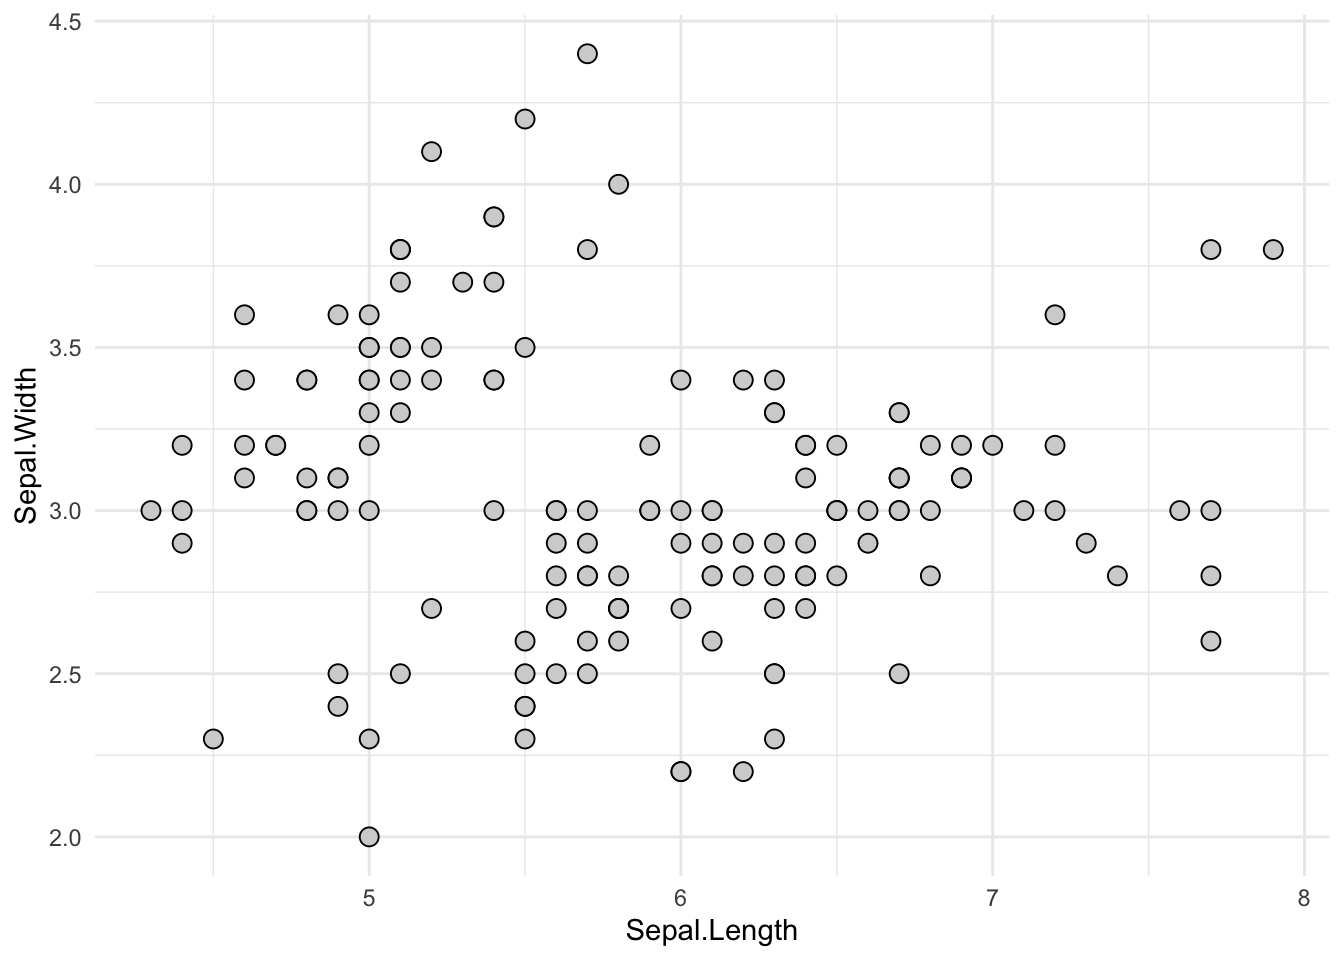
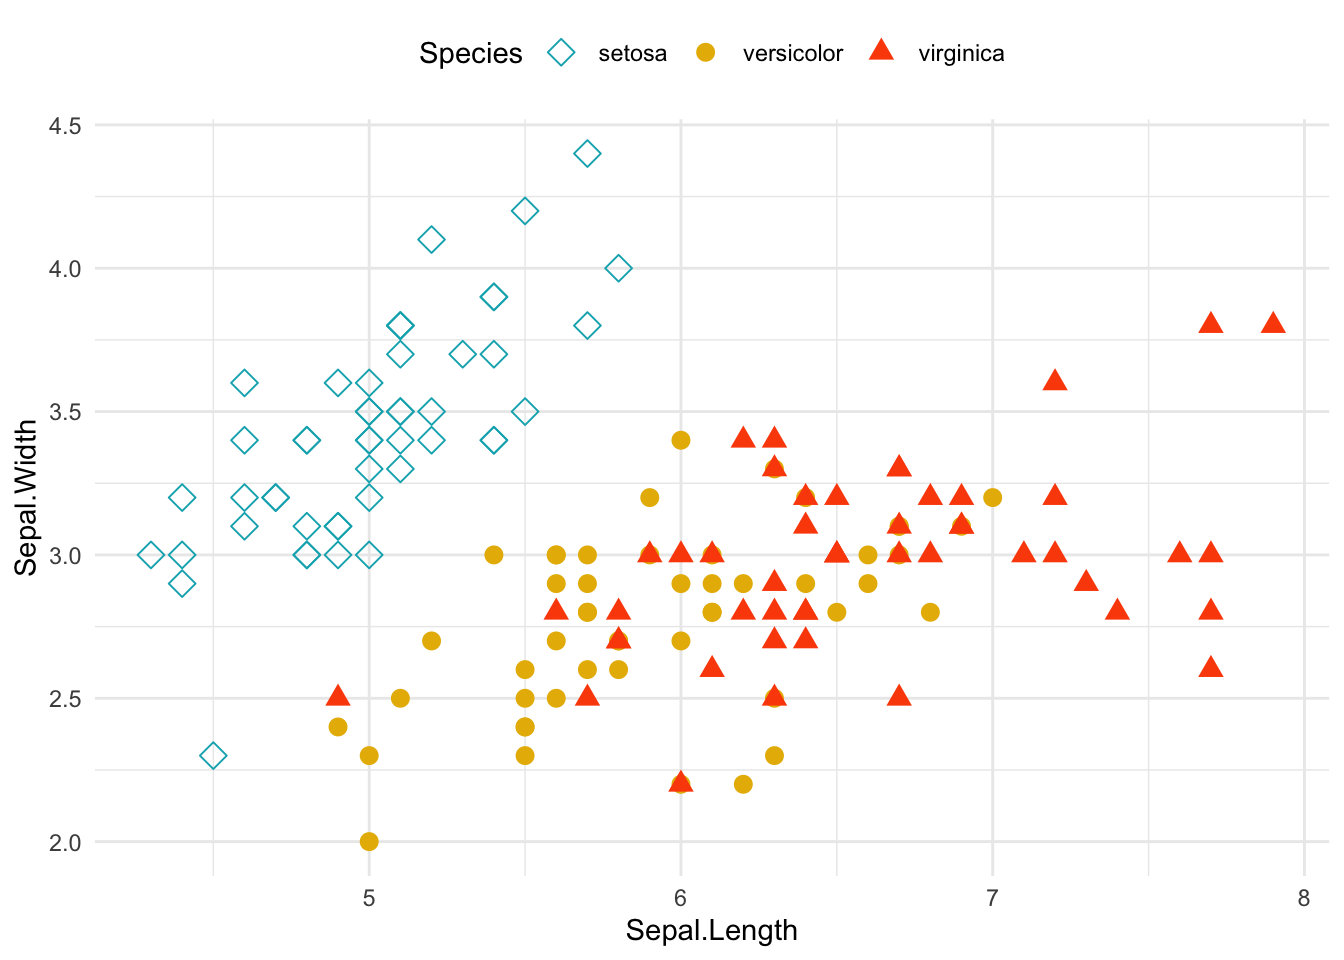
# Change point shapes and colors by groups
ggplot(iris, aes(Sepal.Length, Sepal.Width)) +
  geom_point(aes(shape = Species, color = Species), size = 3) +
  scale_shape_manual(values = c(5, 16, 17)) +
  scale_color_manual(values = c("#00AFBB", "#E7B800", "#FC4E07"))+
  theme_minimal() +
  theme(legend.position = "top")