### Load packages
library(pacman)
p_load(
    tidyverse,  # tidy data
    FactoMineR, # compute principal component methods
    factoextra,  # extract, visualize and interpretate the results
    corrplot  # visualize cos2 of variables
)

### compute pca
head(iris, 3)
##   Sepal.Length Sepal.Width Petal.Length Petal.Width Species
## 1          5.1         3.5          1.4         0.2  setosa
## 2          4.9         3.0          1.4         0.2  setosa
## 3          4.7         3.2          1.3         0.2  setosa
# The variable Species (index = 5) is removed
# before PCA analysis
iris_pca <- PCA(iris[,-5], graph = FALSE)
iris_pca
## **Results for the Principal Component Analysis (PCA)**
## The analysis was performed on 150 individuals, described by 4 variables
## *The results are available in the following objects:
##
##    name               description
## 1  "$eig"             "eigenvalues"
## 2  "$var"             "results for the variables"
## 3  "$var$coord"       "coord. for the variables"
## 4  "$var$cor"         "correlations variables - dimensions"
## 5  "$var$cos2"        "cos2 for the variables"
## 6  "$var$contrib"     "contributions of the variables"
## 7  "$ind"             "results for the individuals"
## 8  "$ind$coord"       "coord. for the individuals"
## 9  "$ind$cos2"        "cos2 for the individuals"
## 10 "$ind$contrib"     "contributions of the individuals"
## 11 "$call"            "summary statistics"
## 12 "$call$centre"     "mean of the variables"
## 13 "$call$ecart.type" "standard error of the variables"
## 14 "$call$row.w"      "weights for the individuals"
## 15 "$call$col.w" "weights for the variables"Compute PCA
Color individuals by groups
fviz_pca_ind(
  iris_pca,
  geom.ind = "point", # show points only (nbut not "text")
  col.ind = iris$Species, # color by groups
  palette = c("#00AFBB", "#E7B800", "#FC4E07"),
  addEllipses = TRUE, # Concentration ellipses
  legend.title = "Groups"
)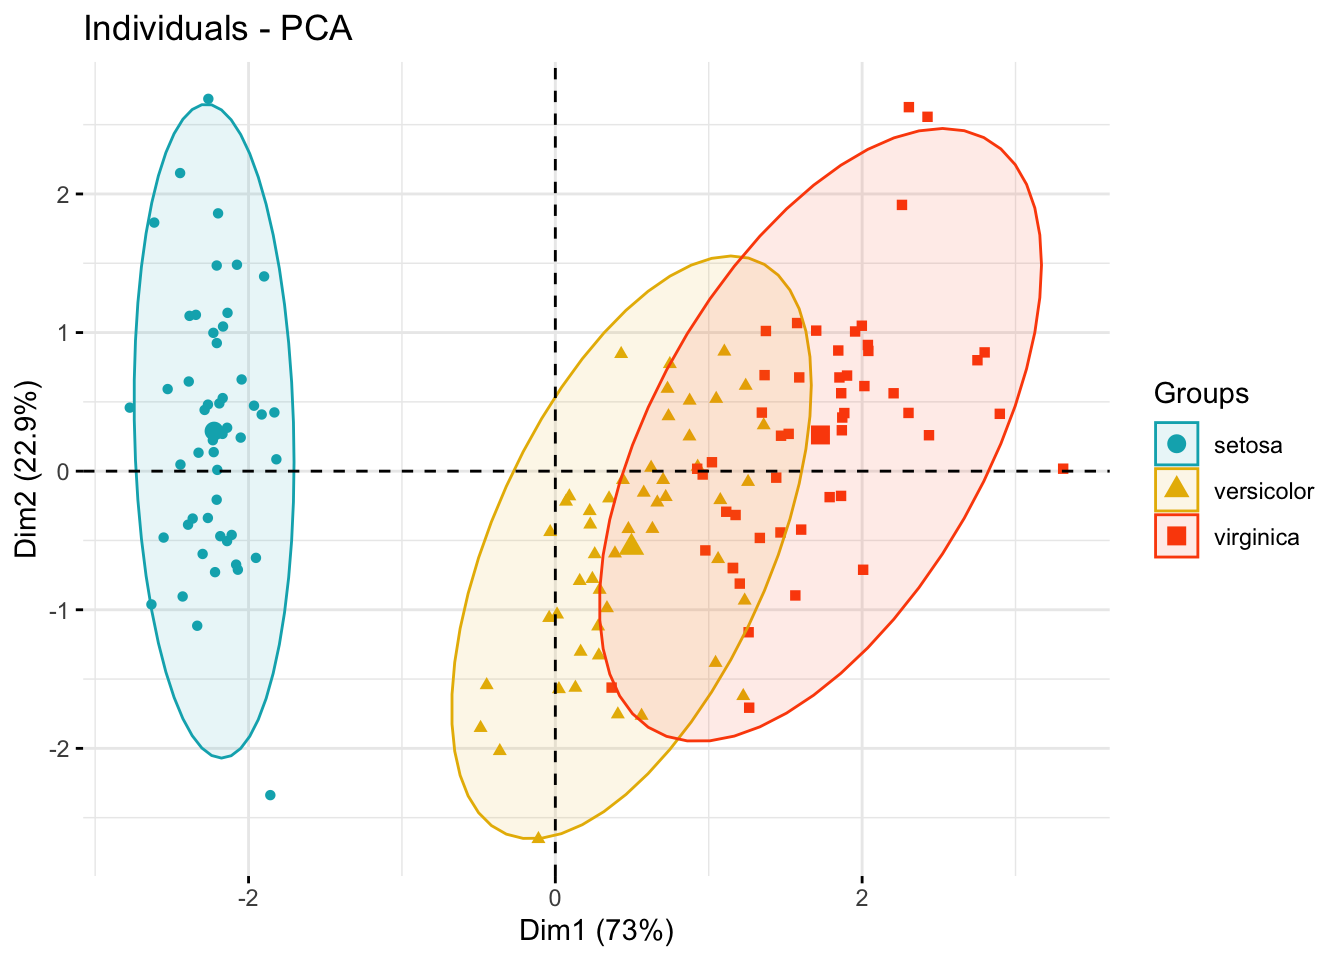
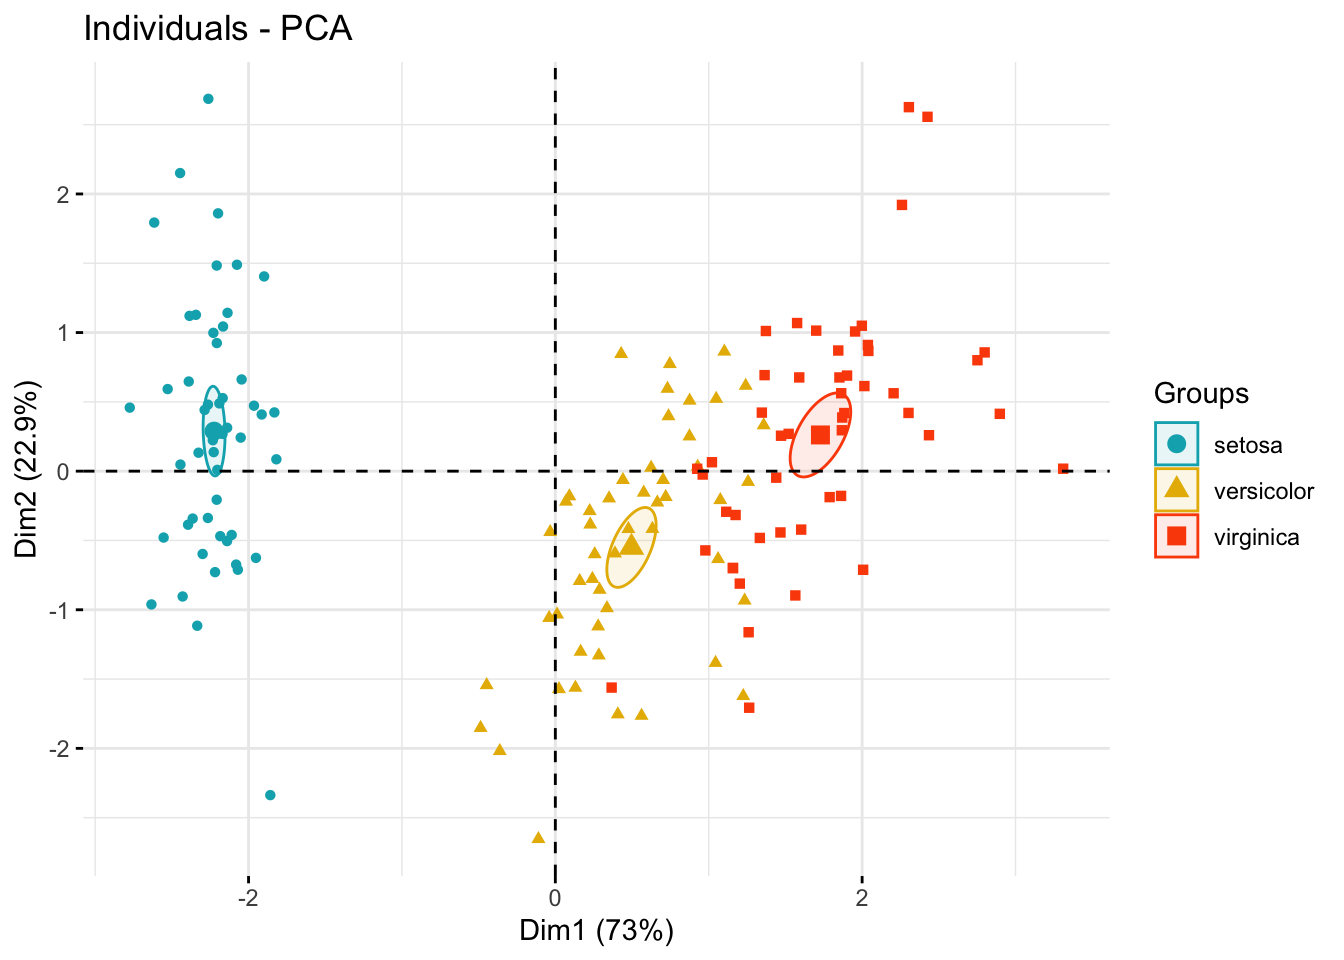
Add confidence ellipses
fviz_pca_ind(
  iris_pca,
  geom.ind = "point",
  col.ind = iris$Species,
  palette = c("#00AFBB", "#E7B800", "#FC4E07"),
  addEllipses = TRUE, ellipse.type = "confidence",
  legend.title = "Groups"
)
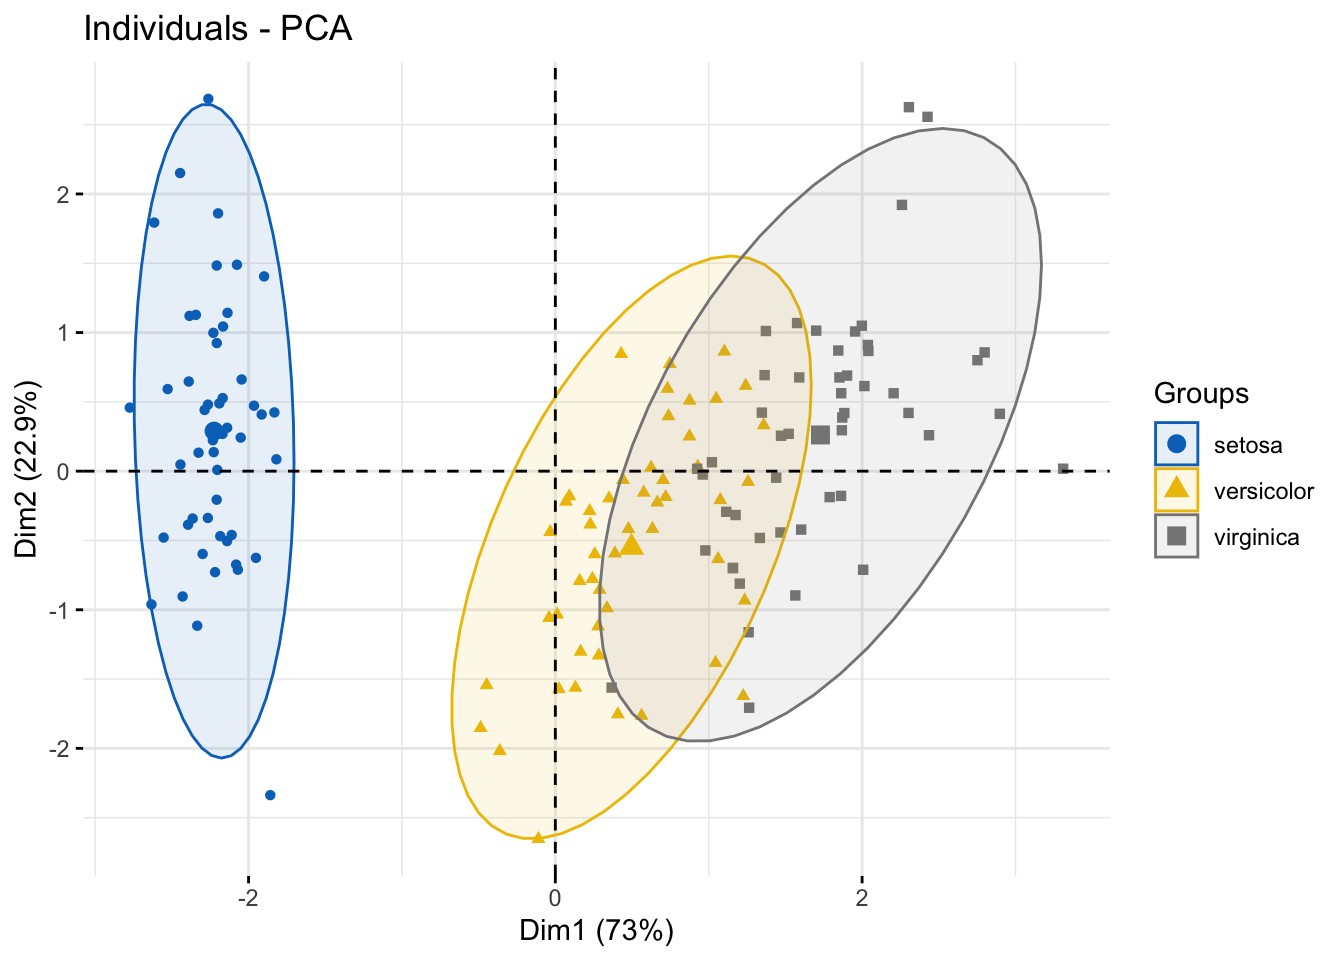
### use color from jco
fviz_pca_ind(
  iris_pca,
  label = "none", # hide individual labels
  habillage = iris$Species, # color by groups
  addEllipses = TRUE, # Concentration ellipses
  palette = "jco"
)
# Add confidence ellipses
fviz_pca_ind(
  iris_pca,
  geom.ind = "point",
  col.ind = iris$Species, # color by groups
  palette = c("#00AFBB", "#E7B800", "#FC4E07"),
  addEllipses = TRUE,
  ellipse.type = "confidence",
  legend.title = "Groups"
)
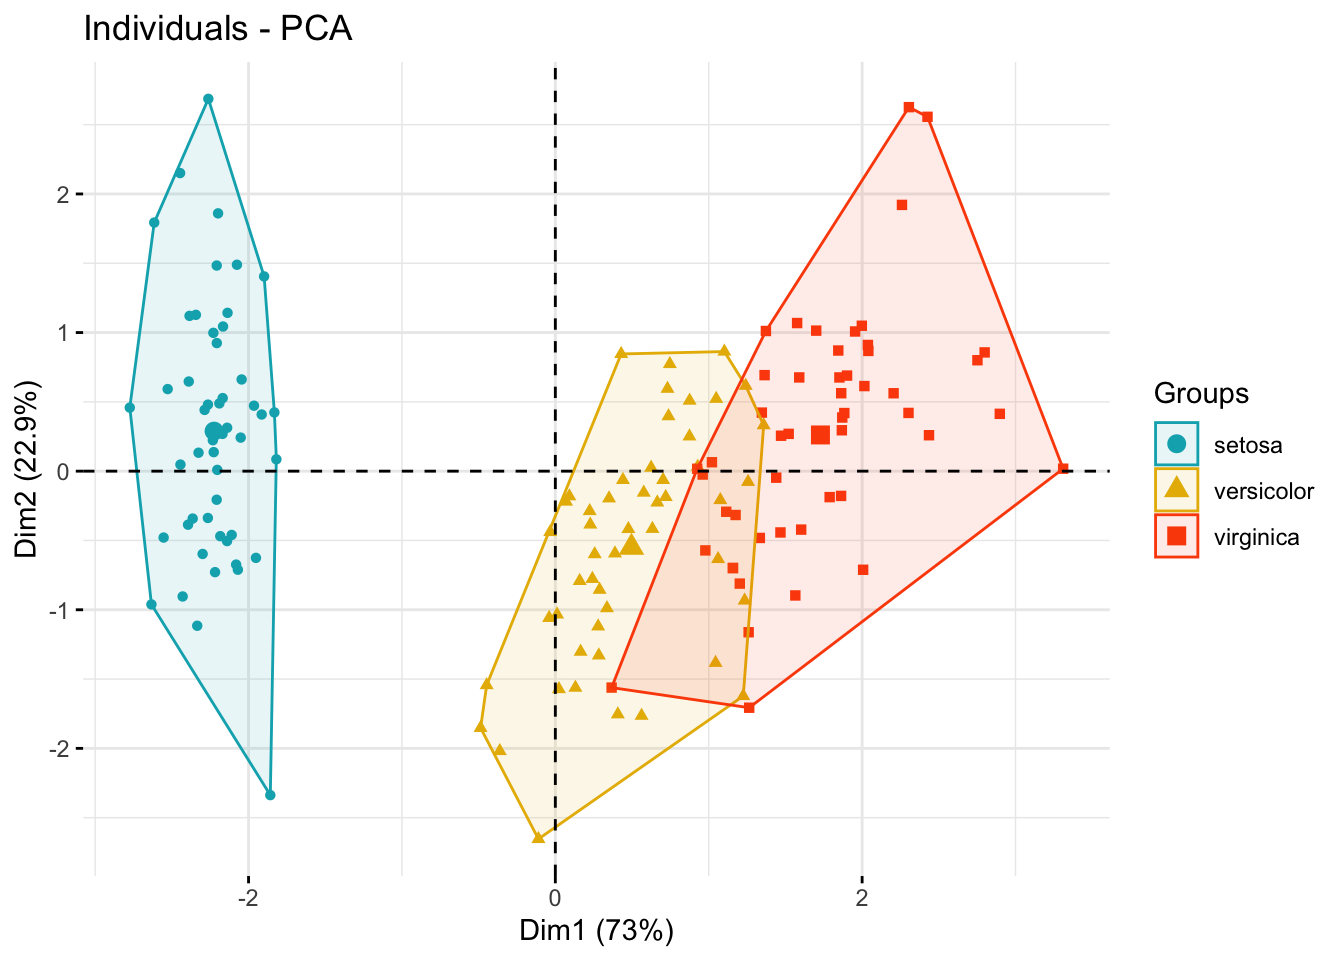
# Convex hull
fviz_pca_ind(
  iris_pca,
  geom.ind = "point",
  col.ind = iris$Species, # color by groups
  palette = c("#00AFBB", "#E7B800", "#FC4E07"),
  addEllipses = TRUE,
  ellipse.type = "convex",
  legend.title = "Groups"
)
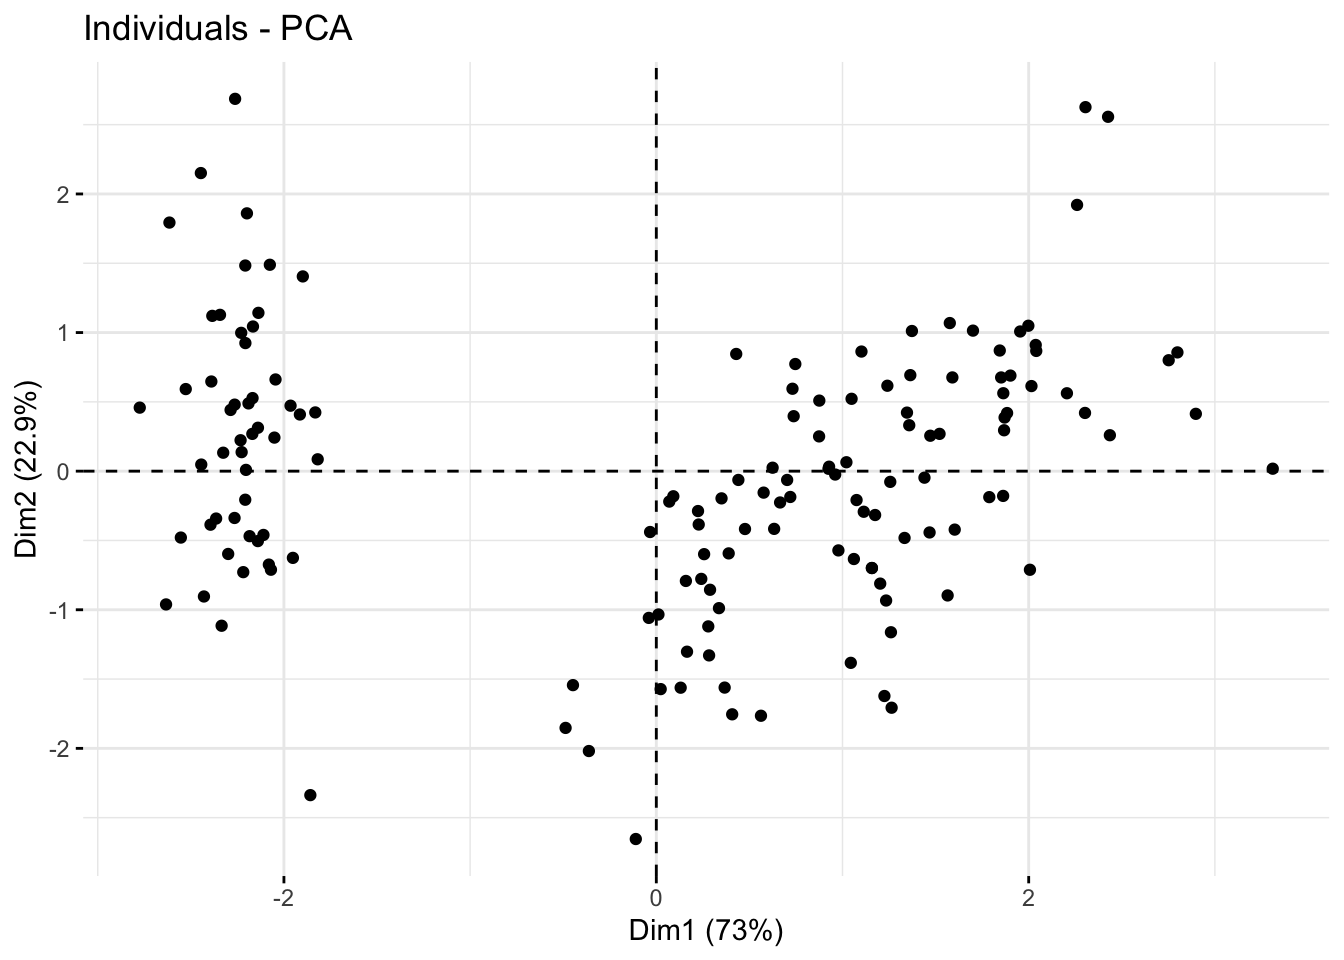
Group mean points
fviz_pca_ind(
  iris_pca,
  geom.ind = "point", # show points only (but not "text")
  group.ind = iris$Species, # color by groups
  legend.title = "Groups",
  mean.point = FALSE
)
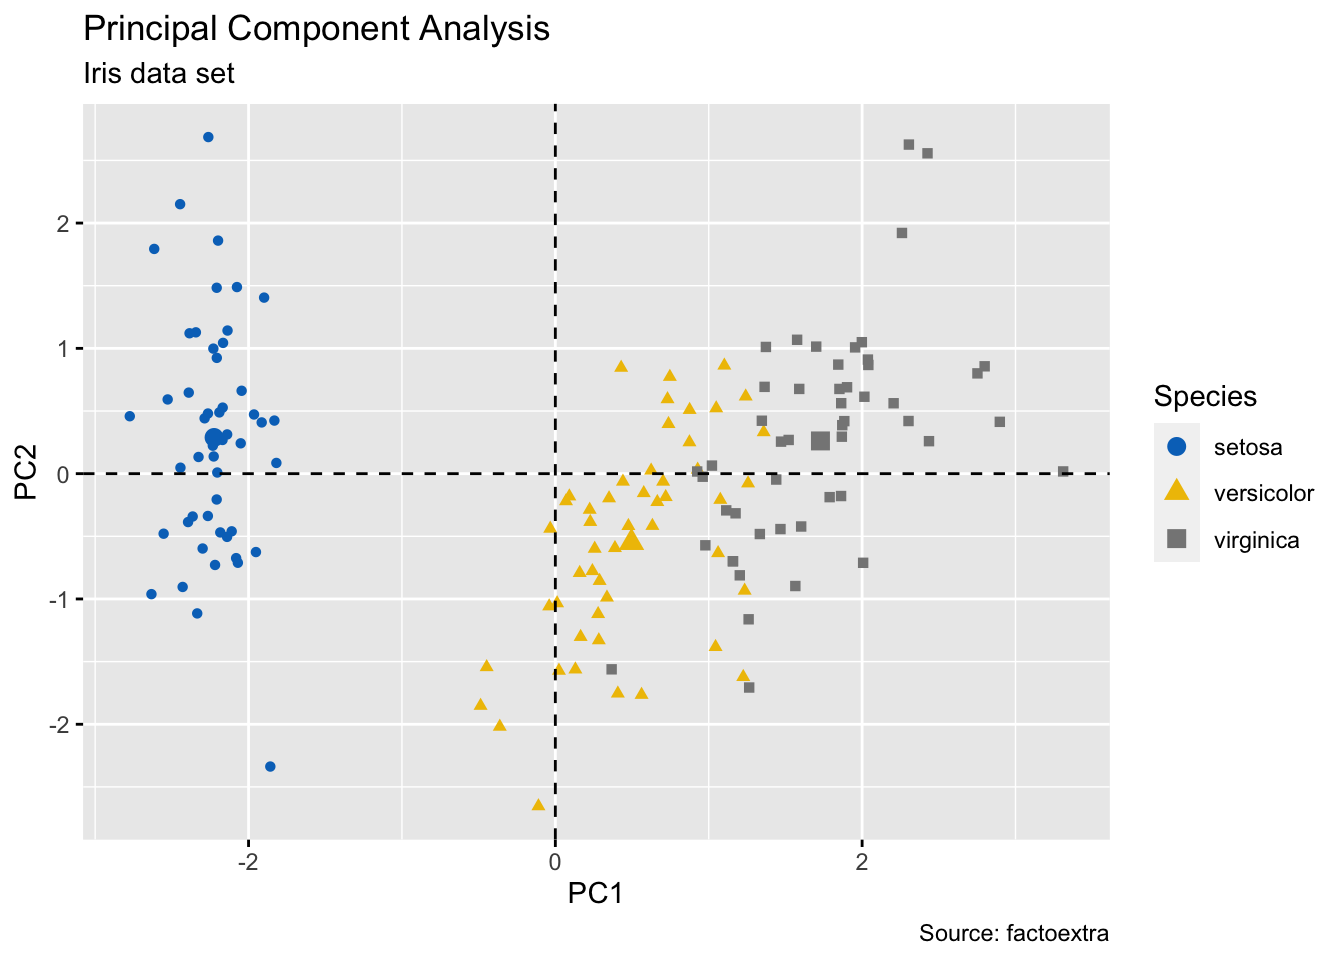
Graphical parameters
To change easily the graphical of any ggplots, you can use the function ggpar() [ggpubr package]
The graphical parameters that can be changed using ggpar() include:
- Main titles, axis labels and legend titles
- Legend position. Possible values: “top”, “bottom”, “left”, “right”, “none”.
- Color palette.
- Themes. Allowed values include: theme_gray(), theme_bw(), theme_minimal(), theme_classic(), theme_void().
ind_p <- fviz_pca_ind(iris_pca, geom = "point", col.ind = iris$Species)

ggpubr::ggpar(ind_p,
              title = "Principal Component Analysis",
              subtitle = "Iris data set",
              caption = "Source: factoextra",
              xlab = "PC1", ylab = "PC2",
              legend.title = "Species", legend.position = "top",
              ggtheme = theme_gray(), palette = "jco"
              )
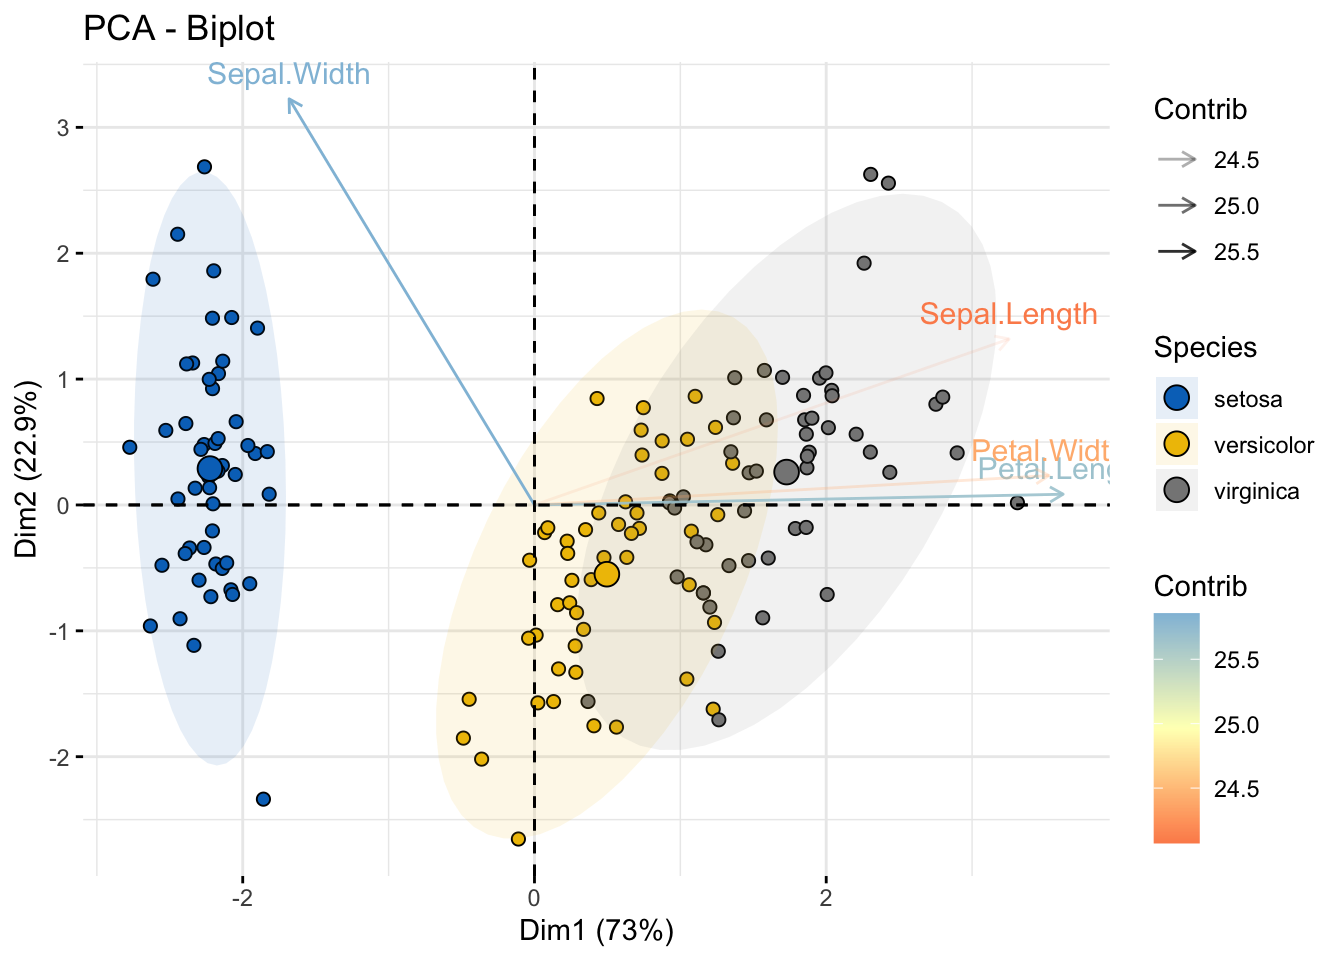
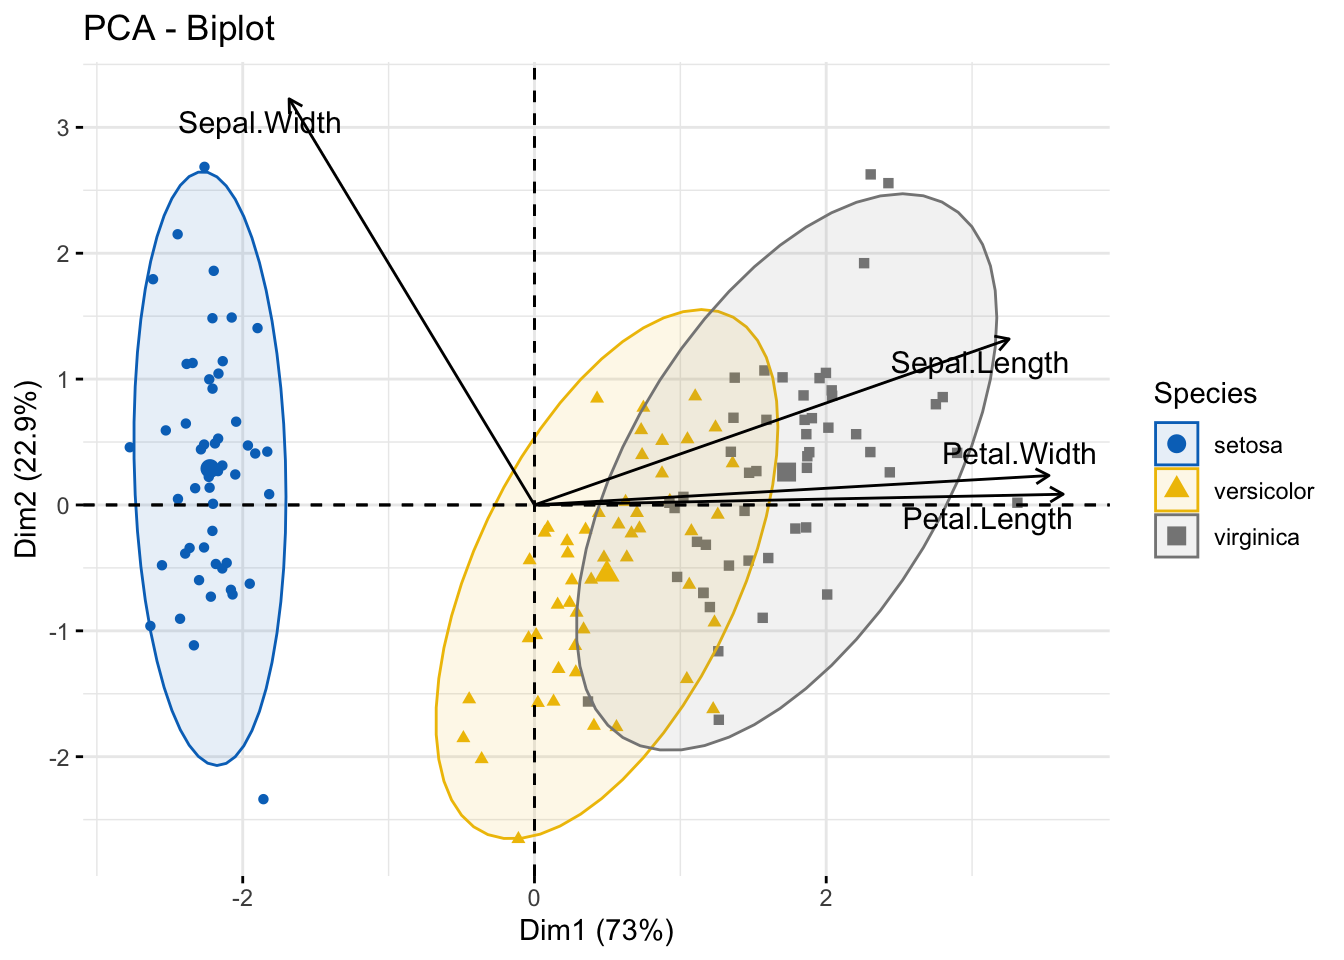
Biplot
fviz_pca_biplot(
  iris_pca,
  col.ind = iris$Species,
  palette = "jco",
  addEllipses = TRUE,
  label = "var",
  col.var = "black",
  repel = TRUE,
  legend.title = "Species"
) 
Color by groups
fviz_pca_biplot(
  iris_pca,
  # Fill individuals by groups
  geom.ind = "point",
  pointshape = 21,
  pointsize = 2.5,
  fill.ind = iris$Species,
  col.ind = "black",
  # Color variable by groups
  col.var = factor(c("sepal", "sepal", "petal", "petal")),
  legend.title = list(fill = "Species", color = "Clusters"),
  repel = TRUE        # Avoid label overplotting
) +
  ggpubr::fill_palette("jco")+      # Indiviual fill color
  ggpubr::color_palette("npg")      # Variable colors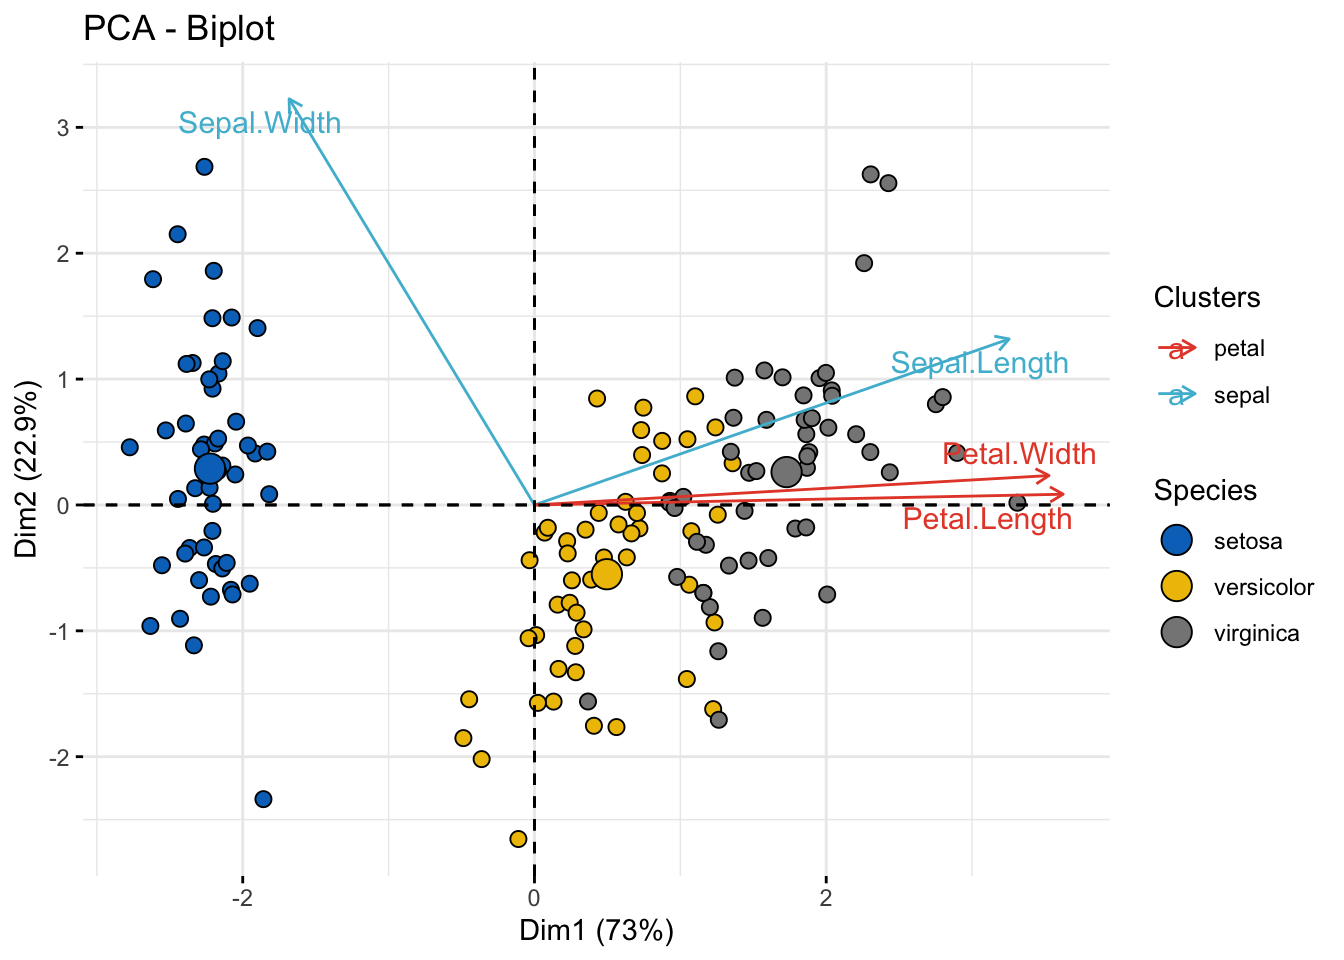
fviz_pca_biplot(
  iris_pca,
  # Individuals
  geom.ind = "point",
  fill.ind = iris$Species,
  col.ind = "black",
  pointshape = 21,
  pointsize = 2,
  palette = "jco",
  addEllipses = TRUE,
  # Variables
  alpha.var ="contrib",
  col.var = "contrib",
  gradient.cols = "RdYlBu",
  legend.title = list(
    fill = "Species",
    color = "Contrib",
    alpha = "Contrib"
    )
)