
This article describes the following data rescaling approaches:
Standard scaling or standardization
Normalization or Min-Max scaling
Percentile transformation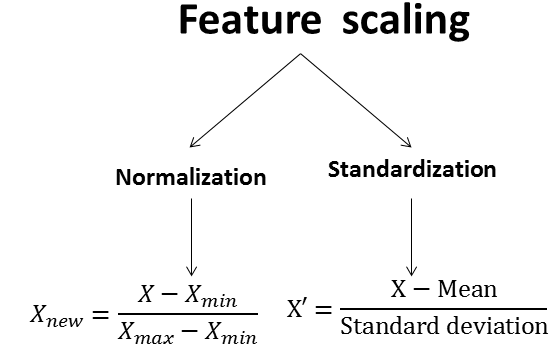
What is feature scaling (normalization)?
In short, feature scaling means to scale the data into a fixed range — generally between 0 and 1. Normalization is normally performed when doing a multivariate analysis where you want each feature (variable) to contribute equally to the analysis.
Standard scaling
Standard scaling, also known as standardization or Z-score normalization, consists of subtracting the mean and divide by the standard deviation. In such a case, each value would reflect the distance from the mean in units of standard deviation.
If we would assume all variables come from some normal distribution, then scaling would bring them all close to the standard normal distribution. The resulting distribution has a mean of 0 and a standard deviation of 1.
Standard scaling formula:
\[Transformed.Values = \frac{Values - Mean}{Standard.Deviation}\]
An alternative to standardization is the mean normalization, which resulting distribution will have between -1 and 1 with mean = 0.
Mean normalization formula:
\[Transformed.Values = \frac{Values - Mean}{Maximum - Minimum}\]
Standardization and Mean Normalization can be used for algorithms that assumes zero centric data like Principal Component Analysis(PCA).
Normalization
When variables in the data comes from possibly different (and non-normal) distributions, other transformations may be in order. Another possibility is to normalize the variables to brings data to the 0 to 1 scale by subtracting the minimum and dividing by the maximum of all observations.
This preserves the shape of each variable’s distribution while making them easily comparable on the same “scale”.
Formula to normalize data between 0 and 1 :
\[Transformed.Values = \frac{Values - Minimum}{Maximum - Minimum}\]
Formula to rescale the data between an arbitrary set of values [a, b]:
\[Transformed.Values = a + \frac{(Values - Minimum)(b-a)}{Maximum - Minimum}\]
where a,b are the min-max values.
Normalize data in R. Using the Min-Max normalization function on mtcars data easily reveals columns with only two (am, vs) or three (gear, cyl) variables compared with variables that have a higher resolution of possible values: