library(readxl)
library(tidyverse)
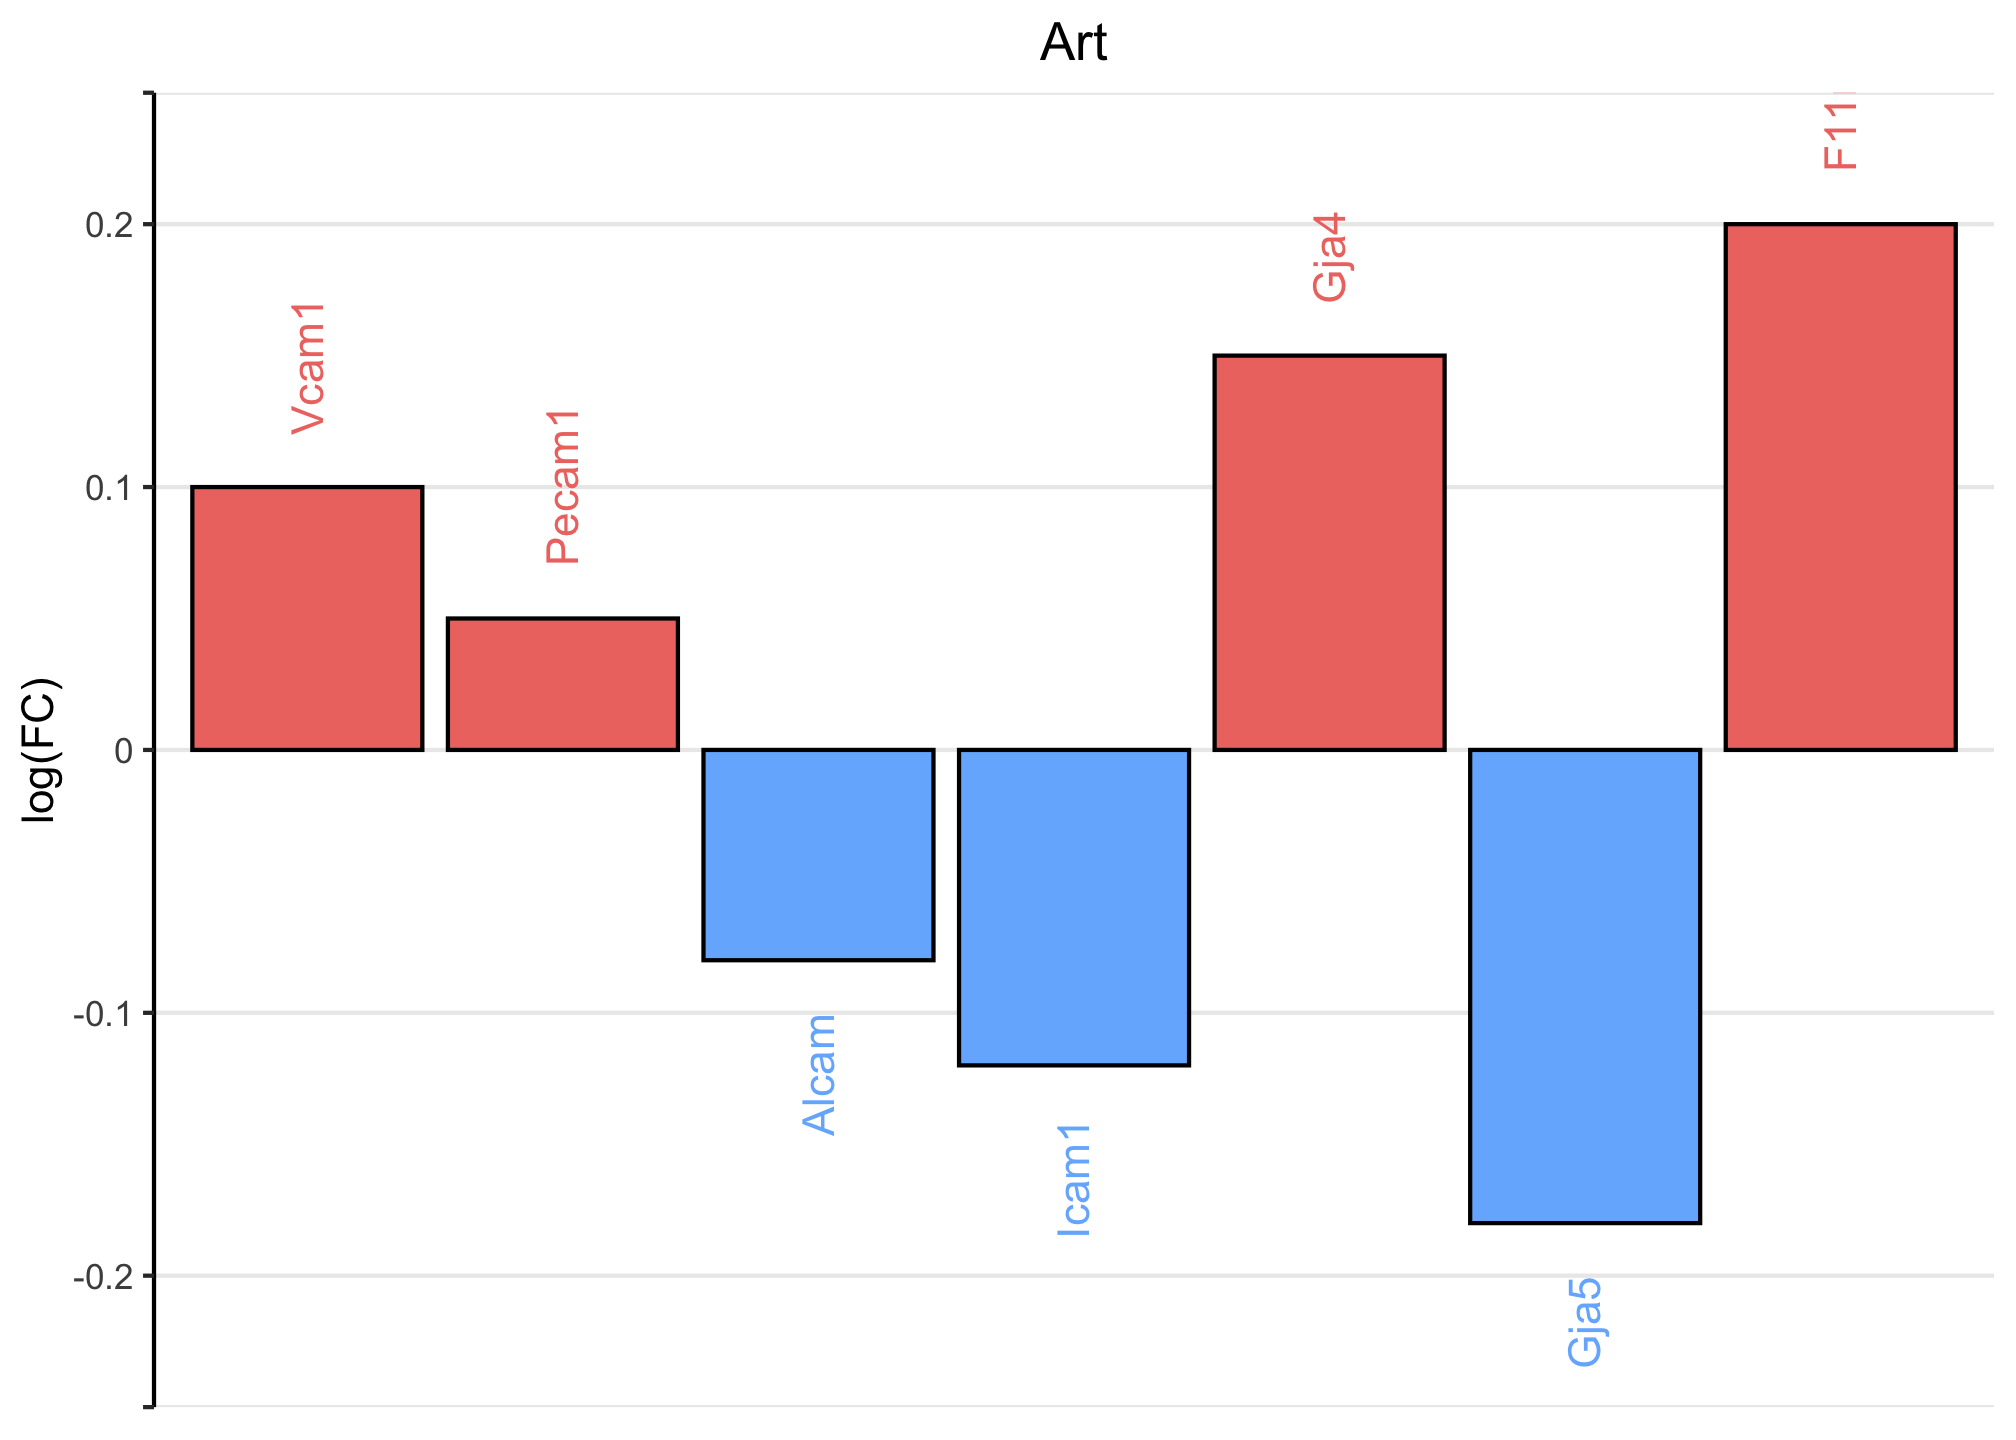
x <- c("Vcam1", "Pecam1", "Alcam", "Icam1", "Gja4", "Gja5", "F11r")
y <- c(0.1, 0.05, -0.08, -0.12, 0.15, -0.18, 0.2)
fig3r.df <- data.frame(x, y)
fig3r.df %>%
mutate(x=factor(x,levels = c("Vcam1","Pecam1","Alcam","Icam1","Gja4","Gja5","F11r"))) %>%
ggplot(aes(x, y)) +
geom_col(aes(fill = ifelse(y < 0, "Negative", "Positive")), color = "black") +
geom_text(aes(y = ifelse(y < 0, y - 0.02, y + 0.02),
label = x, color = ifelse(y < 0, "Negative", "Positive")),
angle = 90, hjust = ifelse(y < 0, 1, 0)) +
scale_fill_manual(values = c("Positive" = "#ee7770", "Negative" = "#77b5fe"),
guide = "none") +
scale_color_manual(values = c("Positive" = "#ee7770", "Negative" = "#77b5fe")) +
theme_classic() +
theme(axis.line.x = element_blank(),
axis.text.x = element_blank(),
axis.ticks.x = element_blank(),
legend.position = "none",
panel.grid.major.y = element_line(),
plot.title = element_text(hjust = 0.5)) +
scale_y_continuous(limits = c(-0.25,0.25),
breaks = c(-0.25,seq(-0.2,0.2,by=0.1),0.25),
expand = expansion(mult = c(0,0)),
labels = c("",seq(-0.2,0.2,by=0.1),"")) +
labs(x = NULL, y = "log(FC)", title = "Art")