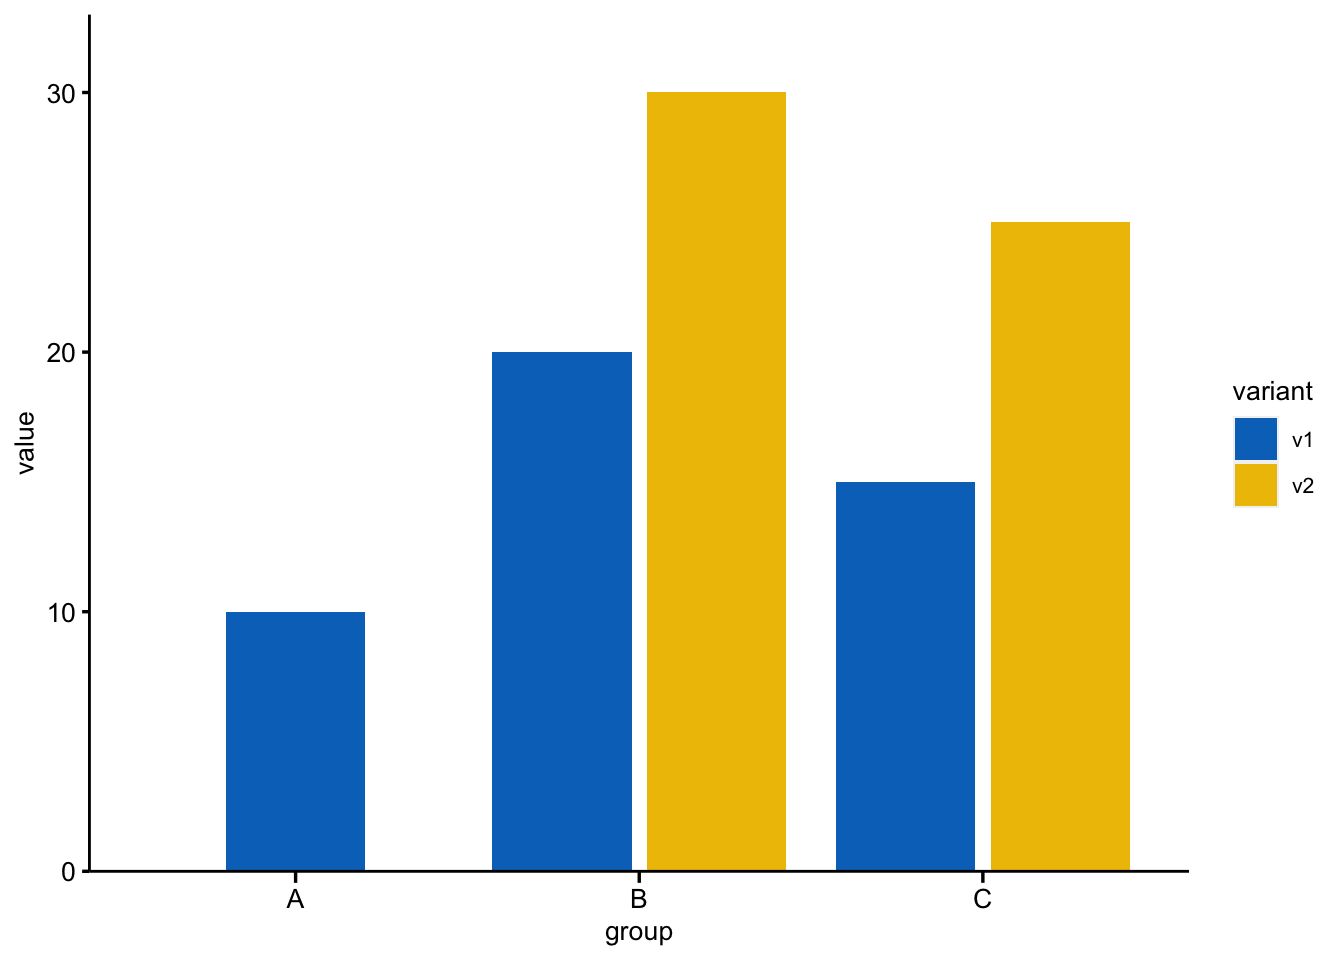
Make the widths of bars to be same when the level of subgroups are not equal
### ---------library(ggplot2)library(ggsci)theme_set(theme( text =element_text(size =10, family ="Arial"), panel.background =element_rect(fill =NA, color =NA), axis.title =element_text(size =10, color ="black"), axis.text =element_text(size =10, color ="black"),# axis.text.x = element_text(angle = 45, hjust = 1, vjust = 1), axis.ticks.length.x =unit(0.3, "lines"), axis.line =element_line(colour ="Black"), axis.ticks =element_line(colour ="black", linewidth =0.6), plot.title =element_text(face ="bold", hjust =0.5, size =10)))# Create a sample dataframedf<-data.frame( group =c("A", "B", "B", "C", "C"), variant =c("v1", "v1", "v2", "v1", "v2"), value =c(10, 20, 30, 15, 25))# Specify the widths for each group and variantwidths<-data.frame( group =c("A", "B", "C"), v1 =c(0.4, 0.8, 0.8), v2 =c(0, 0.8, 0.8)# set width to 0 for variant v2 in group A)# Create the barplot with position_dodge2ggplot(df, aes(x =group, y =value, fill =variant))+geom_bar( stat ="identity", position =position_dodge2(preserve ="single", width =widths))+scale_fill_jco()+scale_y_continuous( expand =expansion(mult =c(0, 0.1)))+scale_x_discrete(breaks =c("A", "B", "C"))# Ensure all groups are displayed in x-axis
In this example, we set widths to be a data frame that specifies the widths for each group and variant. We set the width for v2 in group A to 0 to hide the bar for that variant. Then, we use position_dodge2 with preserve = “single” and the width argument set to widths to create the barplot with different bar widths for each group and variant.