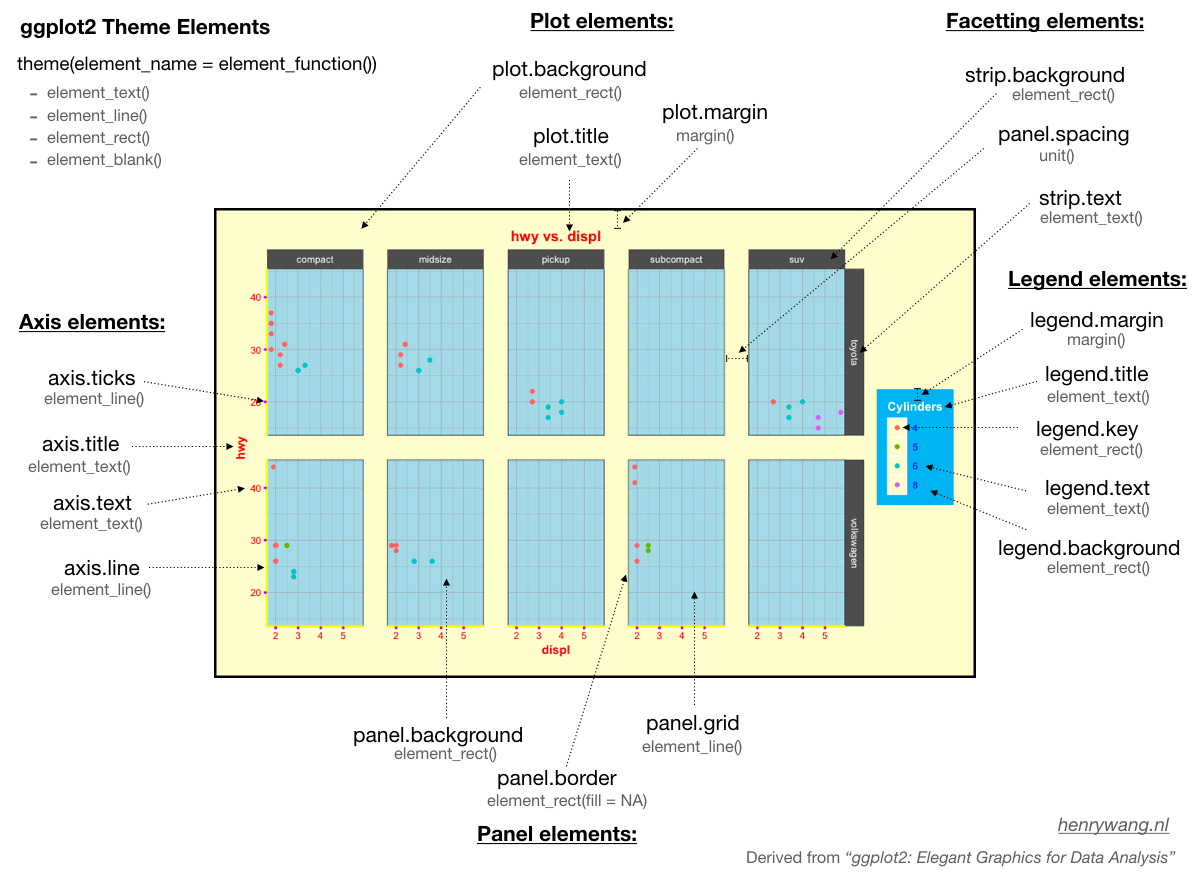
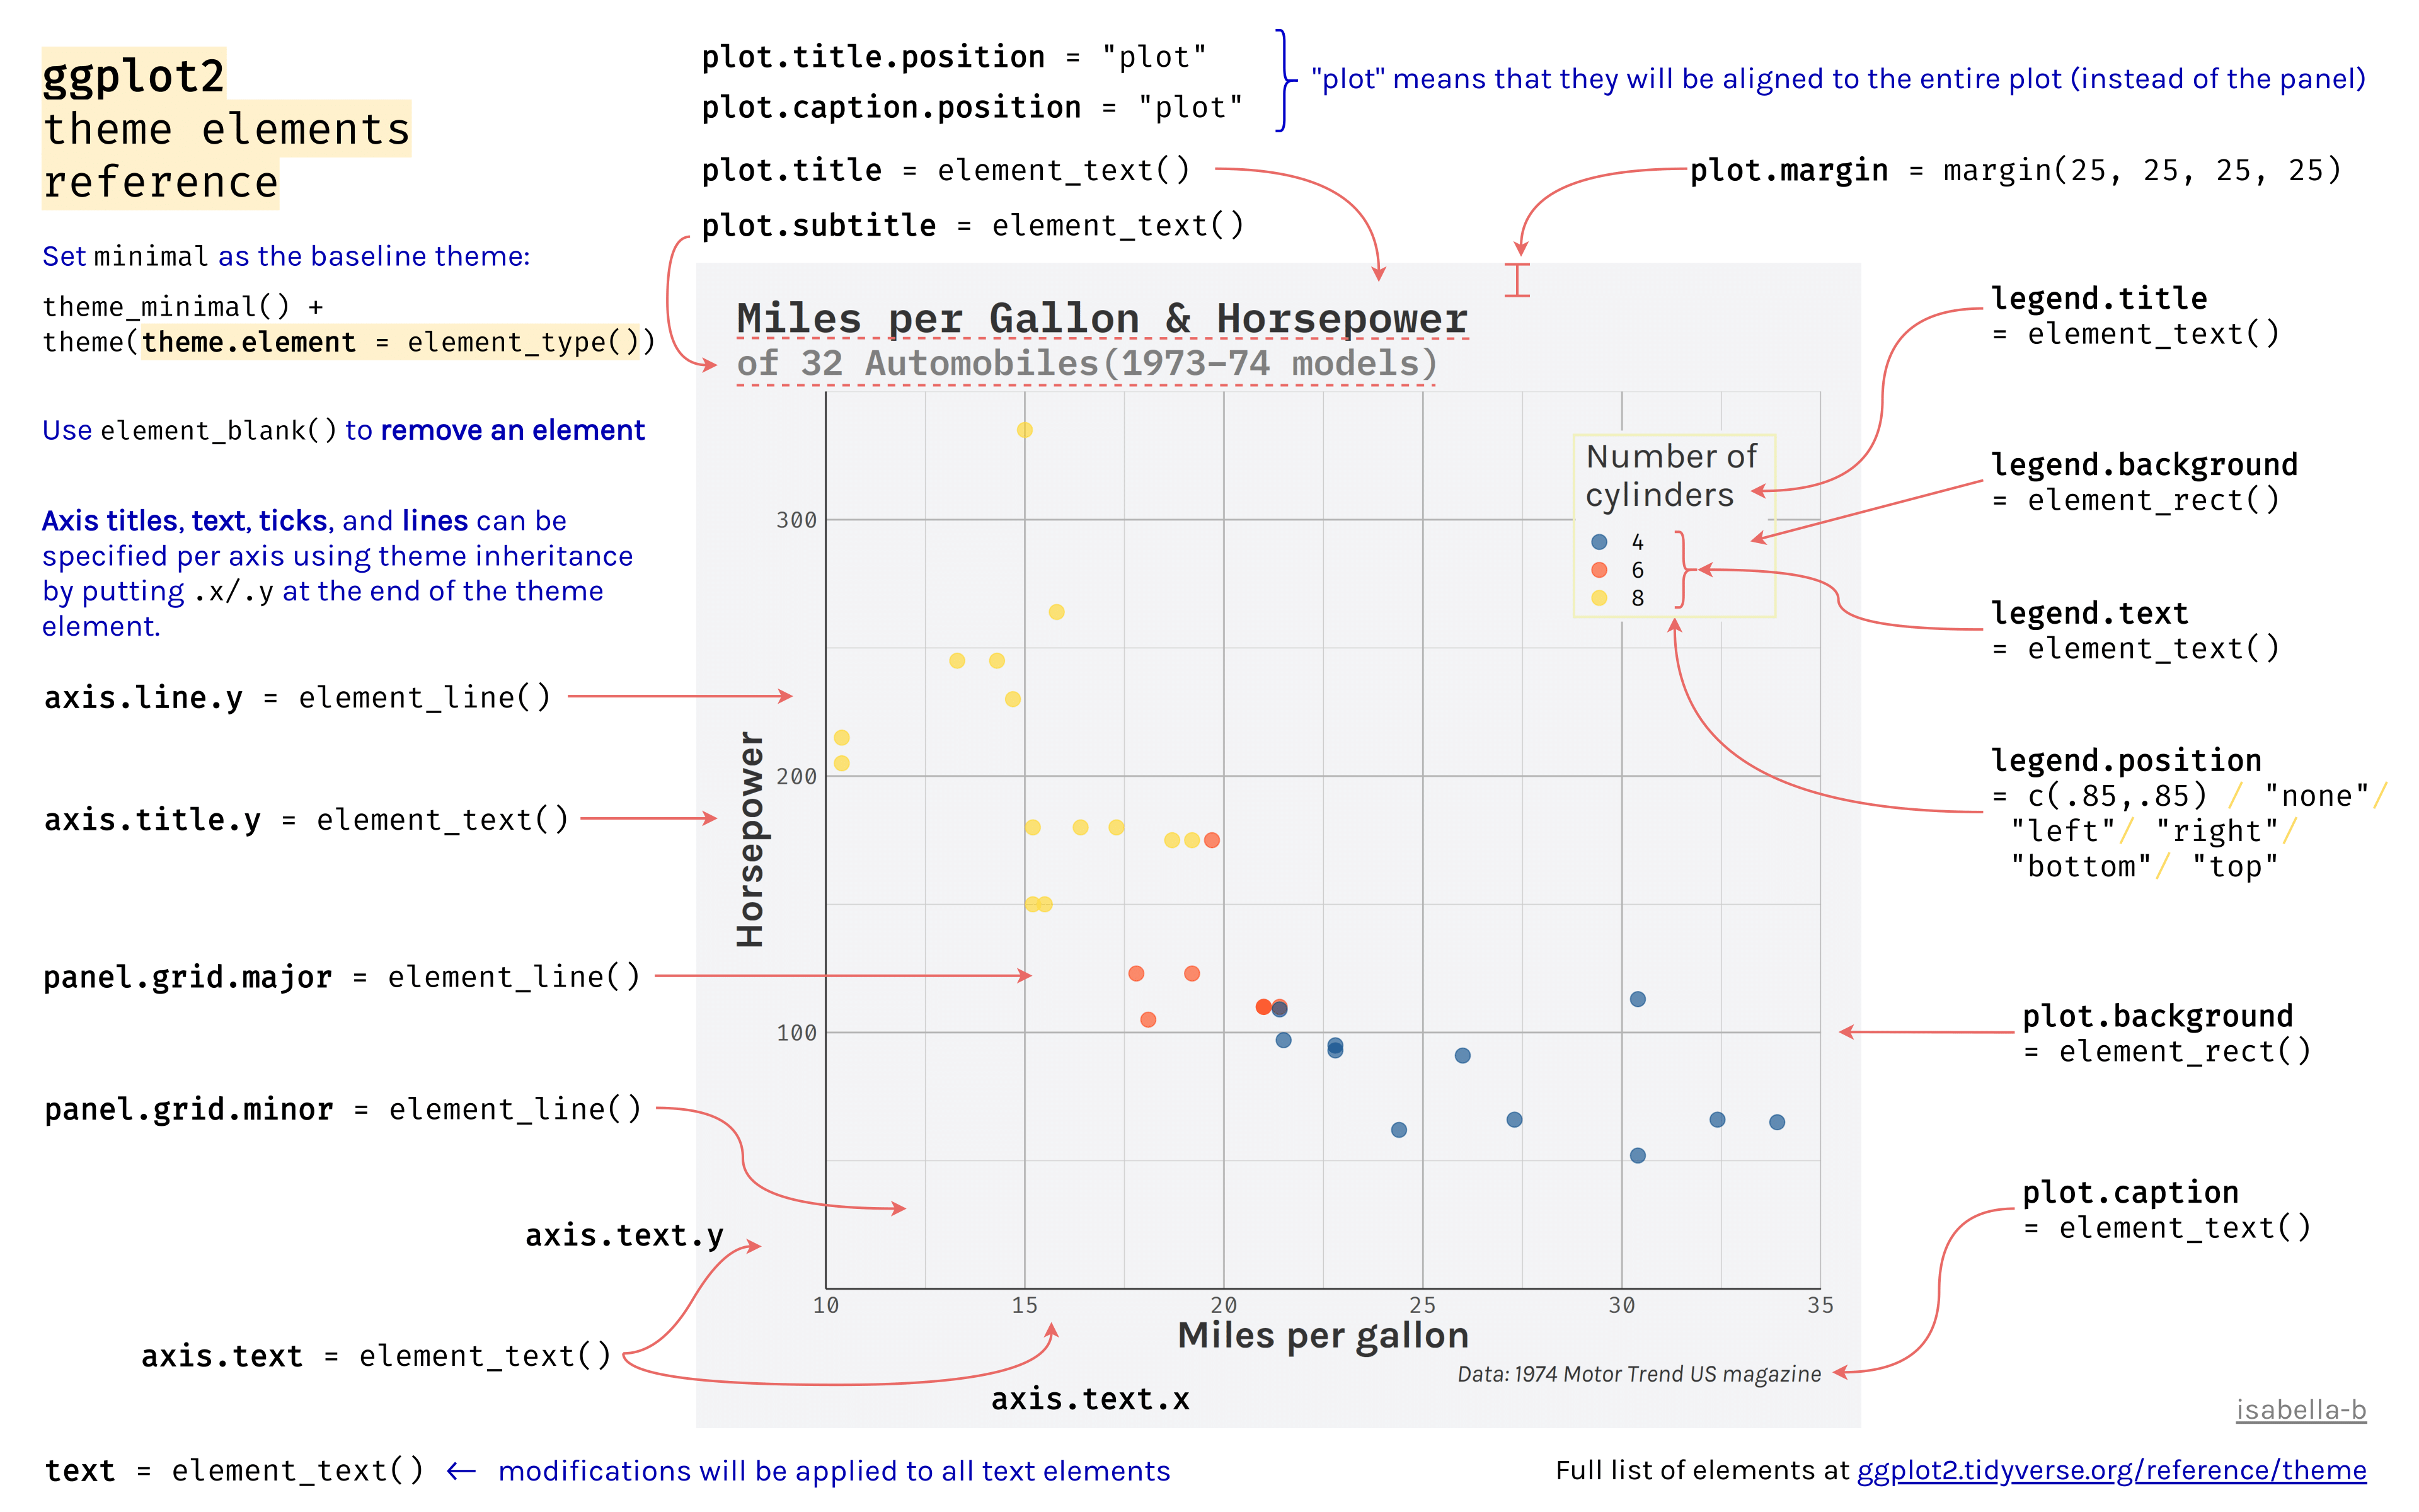
Modify components of a theme: https://ggplot2.tidyverse.org/reference/theme
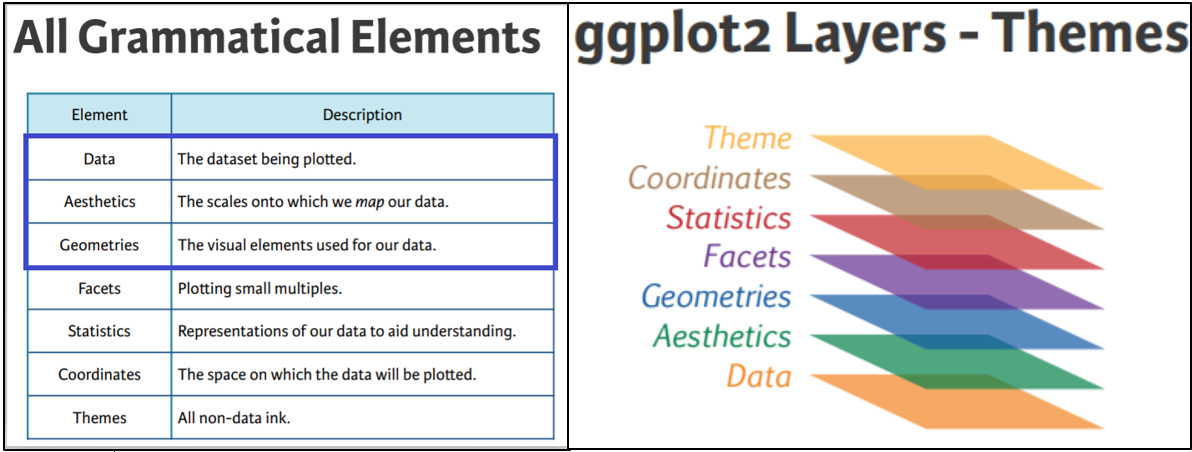
Design Concept of ggplot2
- Theme: styles to be used, such as fonts, backgrounds, etc.
- Coordinates: the plotting space
- Statistics: data models and summaries
- Facets: row and column layout of sub-plots
- Geometries: shapes used to represent data (e.g. bar or scatter plot)
- Aesthetics: the scales onto which the data will be mapped
- Data: the actual data to be plotted
Reference sheet