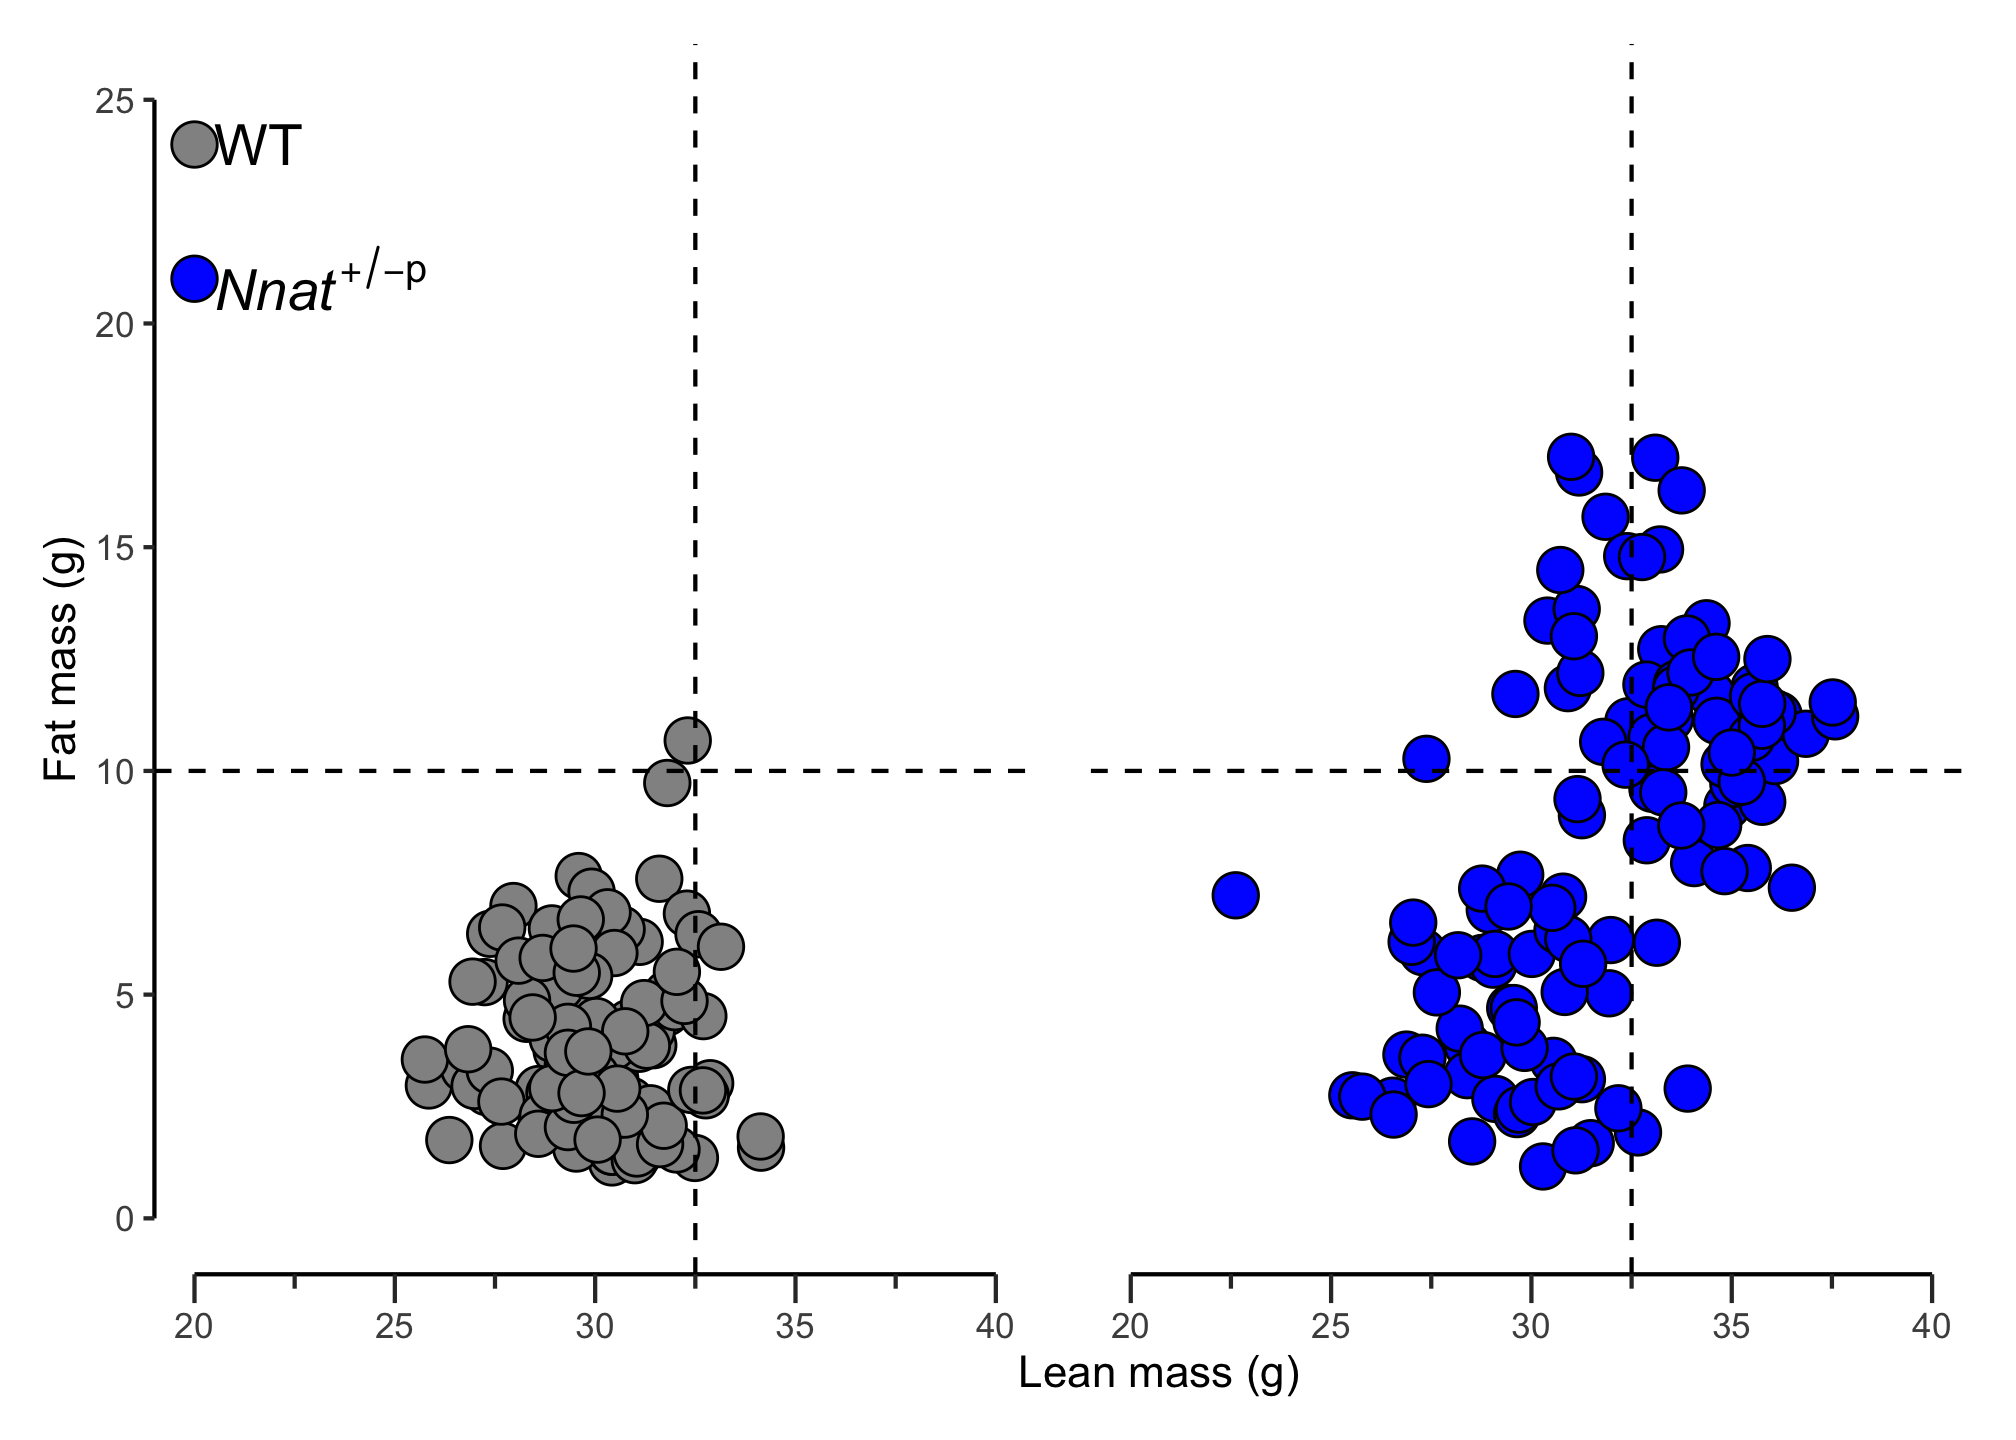
library(readxl)library(tidyverse)library(here)library(ggh4x)library(latex2exp)fig1a<-read_excel(here("projects", "data", "data.xlsx"), sheet ="Figure_1A")fig1a%>%head()## # A tibble: 6 × 5## animal.number genotype Fat.mass Lean.Mass sex ## <dbl> <chr> <dbl> <dbl> <chr>## 1 109 WT 3.87 31.4 Male ## 2 140 WT 6.98 28.0 Male ## 3 141 WT 5.66 29.6 Male ## 4 144 WT 4.37 30.8 Male ## 5 145 WT 4.32 29.1 Male ## 6 199 WT 1.62 27.7 Male
p1<-fig1a%>%filter(genotype=="WT")%>%ggplot(aes(x =Lean.Mass, y =Fat.mass))+geom_point(shape =21, size =5, fill ="#929292", color ="black")+scale_x_continuous( limits =c(20, 40), breaks =seq(20, 40, 5), guide ="axis_minor", minor_breaks =seq(22.5, 37.5, by =5))+scale_y_continuous( limits =c(0, 25), breaks =seq(0, 25, 5), guide ="axis_minor", minor_breaks =c(8, 12))+theme_classic()+theme( ggh4x.axis.ticks.length.minor =rel(0.5), axis.ticks.length.x =unit(0.5, "lines"))+guides( x =guide_axis_minor(trunc_lower =20, trunc_upper =40), y =guide_axis_truncated(trunc_lower =0, trunc_upper =25))+geom_vline(xintercept =32.5, lty ="dashed")+geom_hline(yintercept =10, lty ="dashed")+labs( x =NULL, y ="Fat mass (g)")+annotate(geom ="point", x =20, y =23+1, shape =21, size =5, fill ="#929292")+annotate(geom ="text", x =20.5, y =23+1, label ="WT", size =5, hjust =0)+annotate(geom ="point", x =20, y =22-1, shape =21, size =5, fill ="#0533ff")+annotate(geom ="text", x =20.5, y =22-1, label =TeX(r"(\textit{Nnat}${^+}{^/}{^-}{^p}$)"), size =5, hjust =0)p2<-fig1a%>%filter(genotype=="Nnat+/-p")%>%ggplot(aes(x =Lean.Mass, y =Fat.mass))+geom_point(shape =21, size =5, fill ="#0533ff", color ="black")+scale_x_continuous( limits =c(20, 40), breaks =seq(20, 40, 5), guide ="axis_minor", minor_breaks =seq(22.5, 37.5, by =5))+scale_y_continuous( limits =c(0, 25), breaks =seq(0, 25, 5), guide ="axis_minor", minor_breaks =c(8, 12))+theme_classic()+theme( ggh4x.axis.ticks.length.minor =rel(0.5), axis.ticks.length.x =unit(0.5, "lines"), axis.line.y =element_blank(), axis.ticks.y =element_blank(), axis.text.y =element_blank())+guides( x =guide_axis_minor( trunc_lower =20, trunc_upper =40), y =guide_axis_truncated( trunc_lower =0, trunc_upper =25))+geom_vline(xintercept =32.5, lty ="dashed")+geom_hline(yintercept =10, lty ="dashed")+labs(x =NULL, y =NULL)library(patchwork)p1+p2+labs(x ="Lean mass (g)")+theme(axis.title.x =element_text(hjust =-0.12))## Warning: The S3 guide system was deprecated in ggplot2 3.5.0.## ℹ It has been replaced by a ggproto system that can be extended.## Warning in is.na(x): is.na() applied to non-(list or vector) of type## 'expression'